


Anatomy of a: Momentum Breakout

Table of Contents:
Overview
Technicals
Trends
Entry
Exits
Risk Management

This post is an in-depth, detailed example of what a good quality Momentum Breakout setup would look like. From start to finish!
I see a lot of articles online on breakout setups but they all lack something. Every article I look at it seems as if someone is trying to use a copywriter to bring you into their site. A lot of the material is incredibly generic and doesn't help to develop one's own system or even give insights into the granular details. Showcasing a real-world example of each step will help to show my thought process from start to finish. If you haven't read:

Please do so first in order to grasp the strategy I am trying to employ.
*I did not enter this trade personally, but this would be a setup I am always looking for!
Overview:
Stock Ticker: SMCI 0.00%↑
Company Name: Super Micro Computer, Inc
Company Description: Super Micro Computer, Inc. engages in the distribution and manufacture of information technology solutions and other computer products. It’s products include twin solutions, MP servers, GPU and coprocessor, MicroCloud, AMD solutions, power supplies, SuperServer, storage, motherboards, chassis, super workstations, accessories, SuperRack, and server management products.
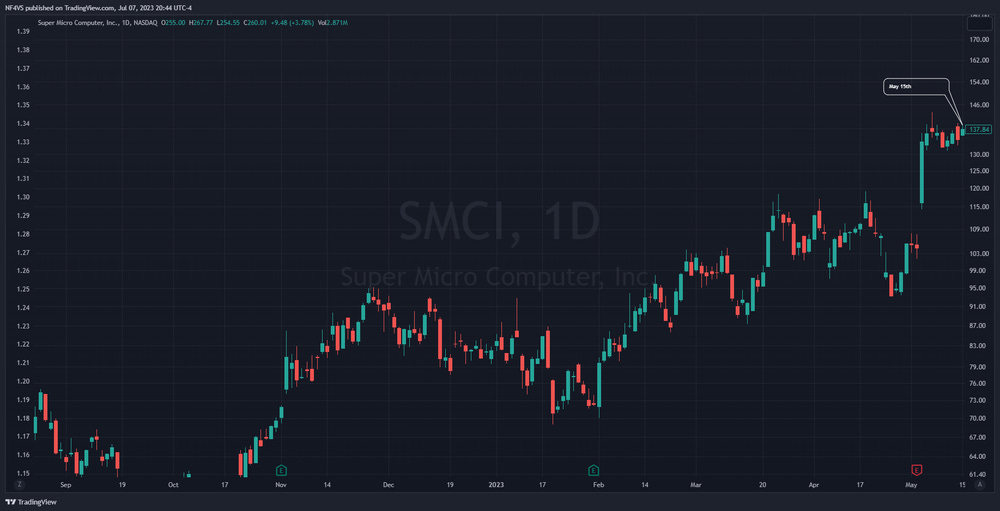
Closing Price (as of May 15th, 2023): $137.84
Float (as of May 15th, 2023): ~45M
Market Cap (as of May 16th, 2023): $8.63B
Date of Breakout: May 16th, 2023
Estimated Entry: $140.950
Estimated Stop Loss: $137.55
Shares Purchased: 29
Risked: 1% of account (~$100)
Profit: $1,795
R-Multiple (Weighted): 20.07x
Technicals
Pattern:
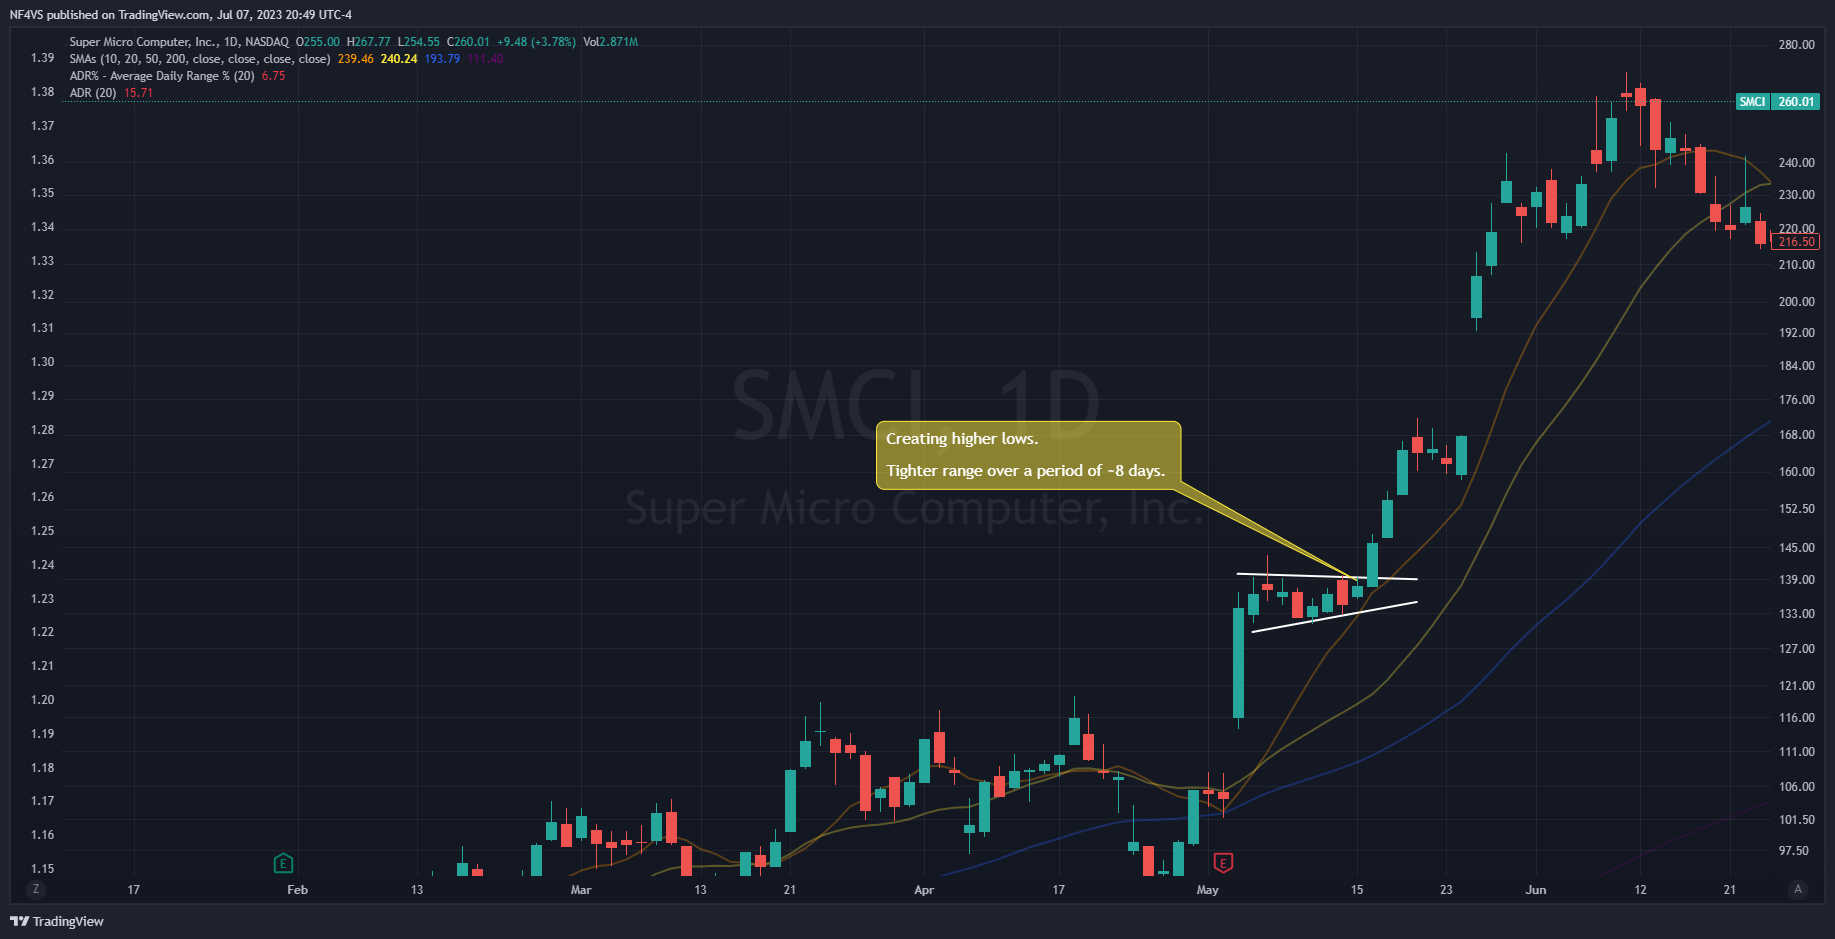
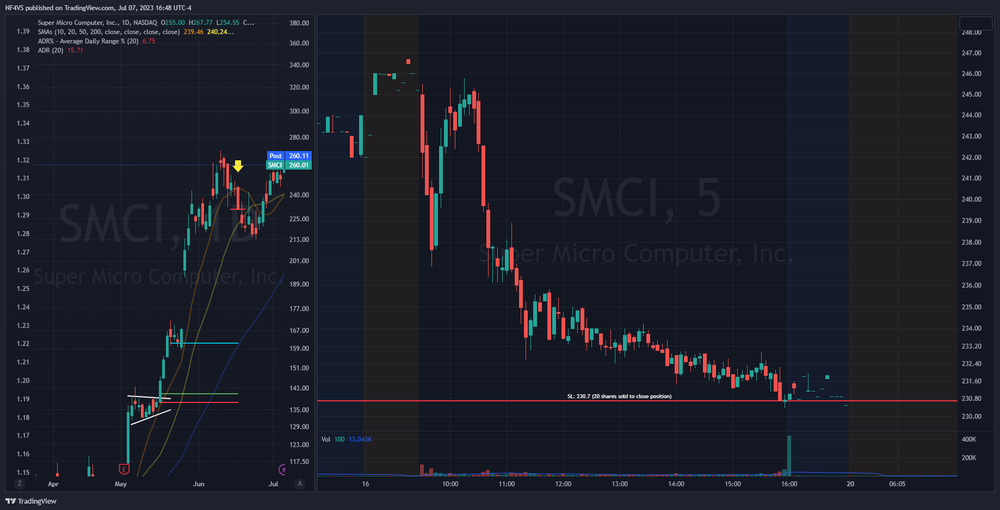
On May 3rd, 2023, SMCI increases 28.27% by the end of the trading day.
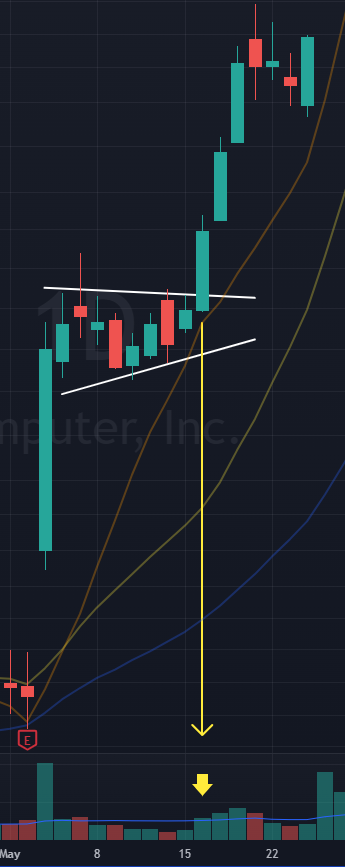
From May 4 - May 15, there is price action consolidation, where the stock stays within a tight range while making higher lows.
On May 16th, SMCI breakouts of this range
Volume:
Within the consolidation phase, there is a declining volume
On the breakout day, volume increases past the 20-day Volume Moving Average (blue line)
There are 2 additional high-volume days extending the price
Moving Average Indicator:
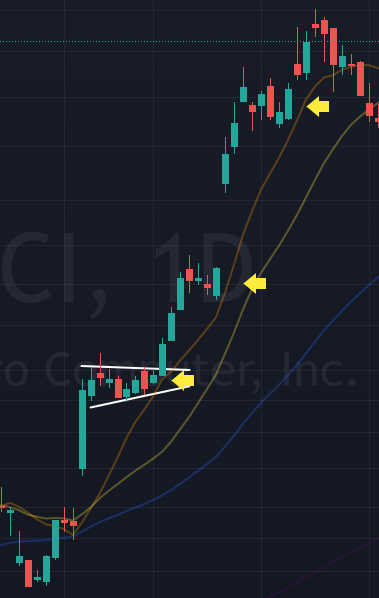
10-day Simple Moving Average (10SMA - orange line) is greater than the 20SMA (yellow line) with both significant upward angles
Clear and sharp bounce on breakout day from the10SMA
After the breakout day, SMCI respects the 10SMA and bounces again 2 more times
Average Daily Range Indicator:
The 20-day ADR% was 5.85% which means this stock moves quickly, which I want to see.
Trends
Overall Market Trend:
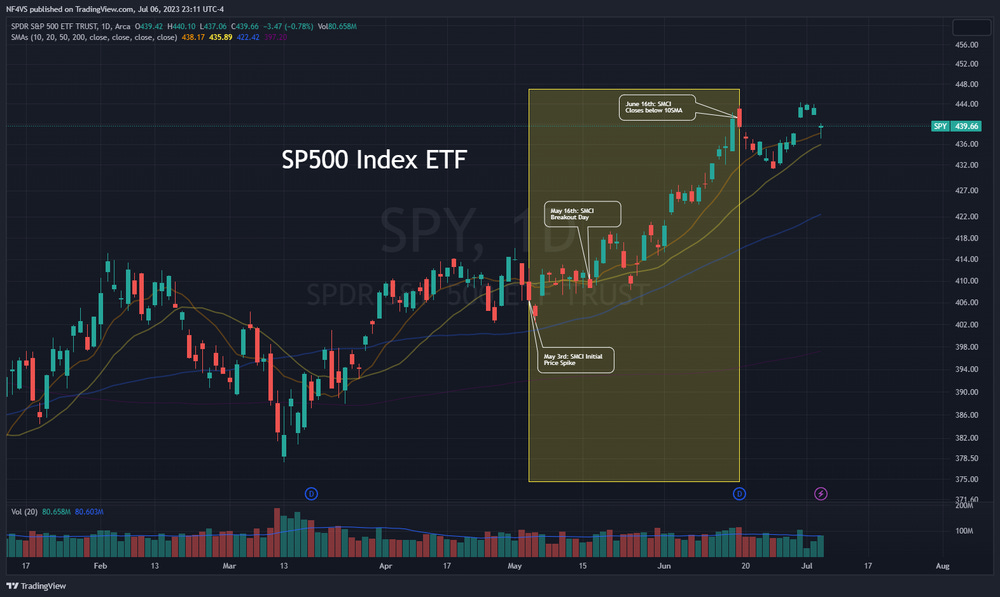
Looking at the Russel 2000 (IWM 0.00%↑) as well as the SP500 (SPY 0.00%↑), the initial SMCI breakout occurs in a relatively brief choppy environment, but the follow-through is a clear uptrend, up until SMCI would have closed below its 10SMA
I included the Russel 2000 which is the small-cap U.S. stock market index that makes up the smallest 2,000 stocks in the Russell 3000 Index (IWV 0.00%↑). I included this as the Russel 2000 holds SMCI (with a 0.5% weight).

During SMCI's breakout phase, it is clear the IWM and SPY are in an uptrend, due to the 10SMA being above the 20SMA for both ETFs as well as both SMA's are strongly slopped upwards.

Also, something to note, SMCI's 1Year Average Beta was in the range of 1.18 - 1.3, which means on average when the market (SPY) moves up, SMCI will also move up and when the market moves down, SMCI will also move down.
Sector/Industry/Theme Trends:

SMCI's sector, industry, and theme can be defined as technology, computer hardware, and computer-storage devices. All 3 in an uptrend.
Within the computer-storage devices, there are also hot themes that SMCI is a part of such as cloud computing and AI that remained hot during the entirety of the trade.
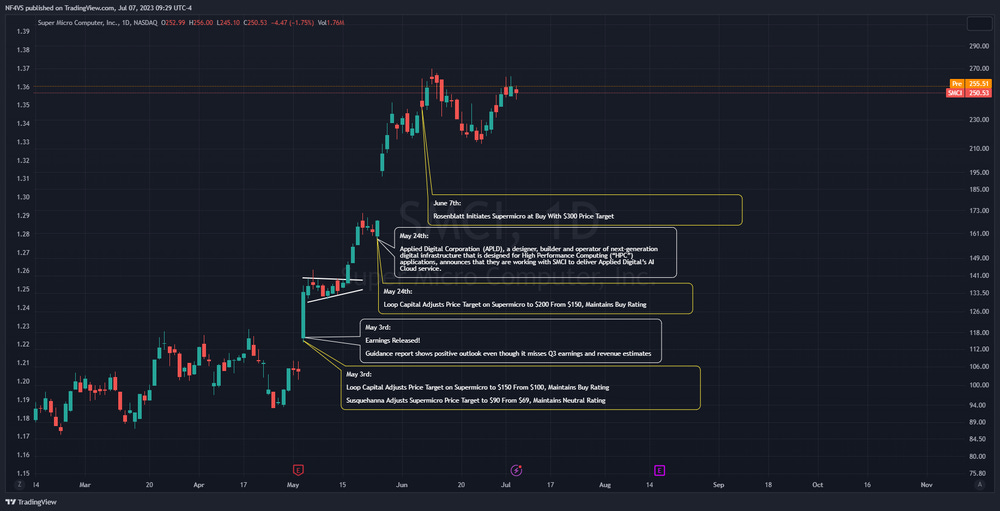
Narrative/Story
The initial 28.27% price increase was due to their earnings being released with a guidance report showing a positive outlook even though it misses Q3 earnings and revenue analyst estimates
The gap up on May 24th seemed to be in relation to, Applied Digital Corporation (APLD 0.00%↑), a company that designs, develops, and operates data centers in North America, announcing that they are working with SMCI to deliver Applied Digital’s AI Cloud service.
There is also strong analyst coverage, with positive price target changes
Entry:
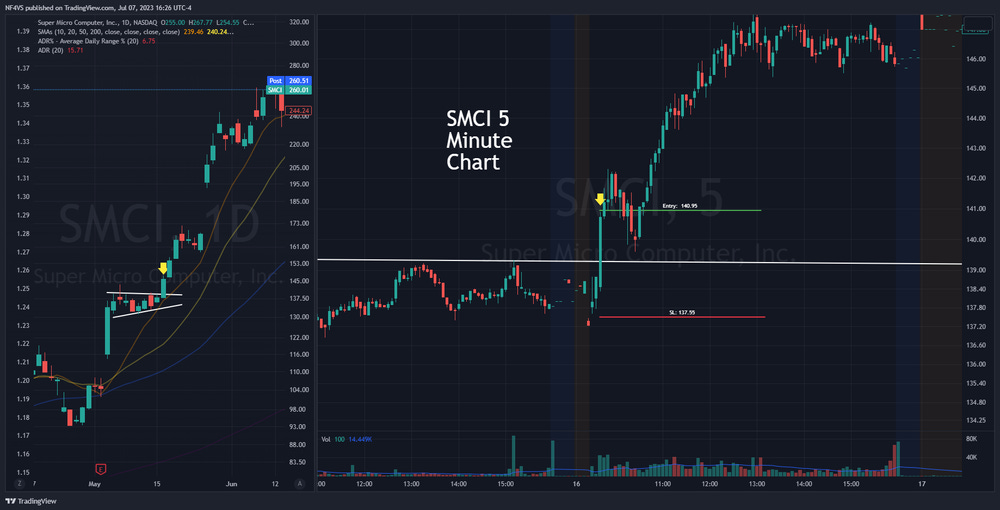
Entry Rules:
The Opening Range High (ORH) on the 5-minute chart didn't show a breakthrough, so we will use the 3rd green candle where there is a clear and obvious breakout of the consolidation phase
Again, a lot of the time, an entry like this will not be as clear cut and you will have to accept being stopped out multiple times on a single stock (if the setup is still there)
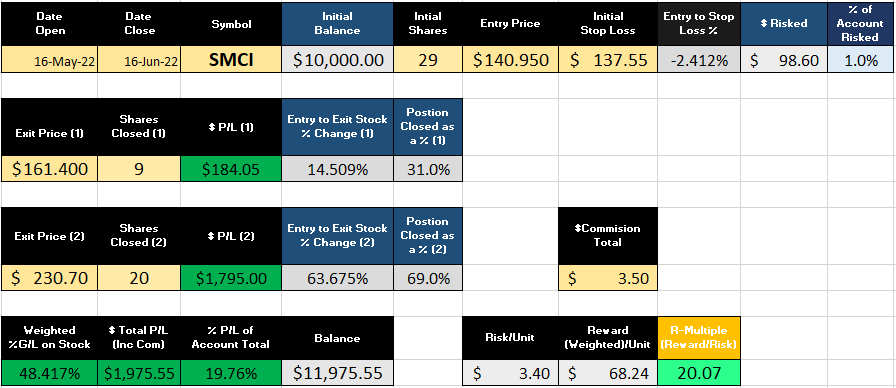
Let's say we assume an account of $10,000. I would, because of how solid the technicals and trends are, risk 1% of the account balance. That means:
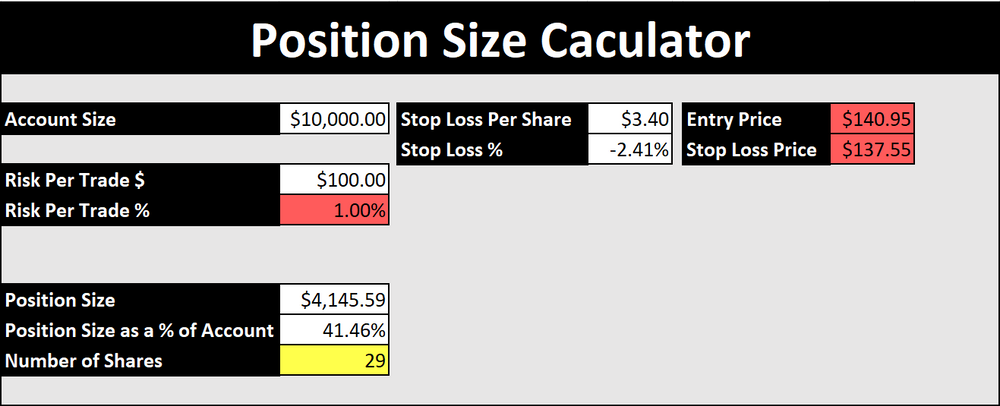
Number of Shares: 29
Entry Price: $140.95
Stop Loss Price: $137.55
The number of shares can be calculated as:
(10,000 * 0.01) / (140.95 - 137.55) = ~29
The 20-day ADR% was 5.85%. On the breakout day, SMCI opened at $137.83. The percentage increase from where our entry to the open of the day is 2.26%. I have considered that my entry is within a respectable range of the ADR%, which is just under 1/2 the current ADR%. This allows for a greater risk-to-reward ratio in my favor.
There is a level of additional risk that results from SMCI's price being in the $100s of dollars. The position size as a percentage of my account will be high (41.46%). Although I am only risking ~$100 and have a stop loss, a rule of thumb is to never have more than 25% of capital in one position. This is due to the possibility that there are gap downs that would bypass the initial stop loss. Because SMCI is a liquid stock and is going off of relatively good news, I am assuming the risk, however, this is something to be aware of with a position size that is >25% of your capital.
I use a Buy Stop order and a Sell Stop order.

Exit:
Initial Stop Loss:
Stop loss was initially placed at the low of the day at $137.55
Take Profits:
On May 19th, after 3 days I would sell 33% of the position in order to lock in profits. I sell 33% as opposed to 50% as I have conviction in the setup.
Take Profits: $161.4 (33% of shares = 9 shares sold)

I then trail the rest of the position using the 10-day SMA. The first close below the 10SMA is on June 16th. I would then have closed the position with a price of $230.7, selling the remaining 20 shares I had left.
Risk Management
Risk To Reward:
The R-Multiple was 20.07x which means we risked 1 unit to make 20.07 units (1 unit being the ($98.6)
The Reward per Unit calculation was weighted based on the number of shares so as to not skew the metric
Account Risk Per Trade:
Account risk per trade was 1% as there were good technicals, trends, and conviction
Position Sizing:
Position Size was higher than normal due to the stocks price being so high
Results:
The total profit from the trade would have been $1,975.55
The portfolio would have grown from $10,000 to $11,975.55
Commission would be in the range of $3 - $4.
Remember these types of 20x risk-to-reward trades do not happen often but when they do, they are powerful in growing an account!
Things to consider:
Subjectivity
Just like art, the setup is in the eye of the beholder. Trading setups like this is a subjective experience. One trader may not see what another trader sees, but really, at the end of the day if you are profitable with the system that you are running, does it really matter?
Sample Selection Bias
There will be selection bias as I am picking a home run type of trade as the example. Even with this example, there is selection bias with picking a very nice-looking setup that cleanly bounces off the SMA's without any risk of fakeouts or any other variable factors that would affect the setup. In the vast majority of cases, this does not happen, but at least, you know what to look for now!