
Finding an Edge: Database & Playbook Creation - Morning Intraday Long Setup
A way to exponentially learn new trading setups without trading live...


The goal of every post is to bring value to the reader while also improving my understanding of the markets.
As I study intraday setups, I thought it would be good to share the data that I have been collecting on intraday-long setups. First, let’s get into the…
If you are just here for the database → Scroll to the bottom of the post
Purpose of Creating a Database/ Playbook:
Finding an edge in the markets! That’s really what it comes down to. The elusive “edge” that all traders dream of.
As a new trader, one of the hardest things to do is figure out what to do and not do. It’s incredibly hard to sort out what is noise vs. relevant information. One solution for this is screen time. Sitting in front of charts. However, the market is only open for a limited time and even then you aren’t able to see every pattern or chart that may look interesting (or even know what is of interest to begin with).
This is why creating a database of a type of setup that has occurred in the past is so important. By tracking past setups that have the same characteristics over time, you are able to extract an edge (hopefully).
A quick overview of what this process is:

Take an idea you have (ie. stock gaps up on a news catalyst and continues to make higher highs in the morning) and find tickers in the past that have behaved in this manner.
Filter out these tickers by metrics you find relevant.
For example, I want tickers with many eyeballs on them so a pre-market volume threshold should be used.
Ask questions about this data to extract edge
For example, one might ask whether the gapped-up stock has a history of holding gap-ups because most stocks will gap-up on news and crash throughout the day. Does each ticker you track have a history of this type of behavior? If the vast majority of these tickers in your database show a history of holding previous gap-ups, well well well, you have gained a small edge.
The more of these questions you answer, the greater your edge will become. And this will be the framework of what a working setup will look like!
Let’s get into the…
Filtered Metrics for the Database:
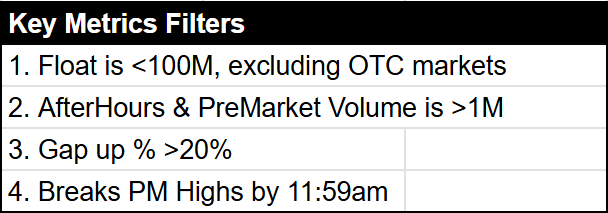
These 4 metrics are what I used to filter out the 1000s of stocks (for this intraday morning long setup) that have made similar moves. Each filter should have a reason for being there. This list is also a work in progress. Remember, we don’t know what we don’t know as traders, and because of that, you may read a trading book or consume content online which may alter your filters. These filters are not concrete. The ultimate goal is to be curious. Curiosity breeds an edge.
Reasoning Behind the Filters:
Float is <100M, excluding OTC markets
The lower the float, the higher the probability the stock will make explosive moves.
AfterHours & PreMarket Volume is >1M
More premarket volume means narrow spreads (less slippage), more price movement, and cleaner price action.
Gap up >20%
Similar to the volume filter.
Breaks PM Highs by 11:59 am
I want to distinguish between random moves throughout the day and from looking at 1000s of charts, this filter gave me a good framework to start from.
Column Explanation:
Over time, I will add columns as I ask more questions about the data. For now, a bit of explanation might help for some of them…
Day of Break
The day the stock gapped up.
Screenshot
A 1-minute candlestick screenshot of the pre-market and intraday price action
Categories
I want to define this setup as “MIL - w/PMV,G,LF” which means Morning Intraday Long - with PM Volume, Gap up, and Low Float

Examples of the Setup:
Currently, there are 58 tracked tickers on this database. Over time I will add more to get a more accurate representation of the answers to my questions.


Creating Your Own Database/ Playbook
If you want to do this yourself, a couple of tools that helped me find stocks to look at:
Zendoo Live Streams (On Youtube)
Helped to find stocks that had huge volume on the day. I had to go through each day’s livestream. This was very tedious but in the beginning, it helped generate ideas for setups.
I started using this platform to help find stocks to add to the database. It has a free version with limited features. It’s a historic stock scanner where you can filter by criteria and will spit out a basic database. I then see what stocks are relevant to my database and go from there. You may think, why not just use this platform to generate the entire database? There are many reasons but simply; there will be criteria you cannot filter for or metrics to your questions that cannot be tracked in platforms like this one. Manual is better!
Barchart has great chart data that goes back decades where most platforms require a paid subscription.
Scanning every day
This will probably be the easiest way to track tickers as you can see what is moving live and then track it for the day. However, when I was just starting out, I had no clue what I was even looking for so this can be done after you have a baseline understanding of how to create a database.
I highly recommend
’s post called “Building A New Playbook” which further expands on the idea of playbooks and databases to enhance a trader’s edge.
Downloading the Google Sheet
For Paid Subscribers, I added a link below to get access to the current database 🔽
Keep reading with a 7-day free trial
Subscribe to A Retail Trader's Repository to keep reading this post and get 7 days of free access to the full post archives.