


[S#2] D) Losing Streak Probabilities (Part 2)

Index:
Series#2: Understanding Losing Streaks 101
D) Losing Streak Probabilities (Part 2)

Key Takeaways:
Further complexity is added when incorporating sample size to determine the probability of specific losing streaks
In general, the more trades performed allow for the possibility that a larger losing streak will occur
To add to my Part 1 of Losing Streak Probabilities, I wanted to go into more nuances about these probabilities as the independent probabilities of a losing streak are not the full story.
I am going to add another variable into the mix in order to simulate a more realistic approach to losing streaks. Instead of looking at the probability of consecutive losses independently, I now want to add the variable of, “total number of trades” to see how these values differ (and they differ significantly)! Now this topic I think is way my intriguing and will be significantly more accurate in the probability of occurances but way more complex!
Let me explain… If I wanted to find the probability of 5 consecutive losing trades with a historical (static) win rate of 25%. To solve this, you would use the formula (1-0.25)^5 equating to 23.73%. Now, this 23.73% chance of getting 5 consecutive losses in a row is the chance to lose 5 specific trades in an instance. But if I wanted to know, out of 100 trades what is the chance of getting 5 or more losses in a row, well that becomes a whole different story.
An example of how this question becomes increasingly more complex can be further expanded on. If you made 100 trades in total then you would have 96 possible places where a 5-streak loss could occur. This is because, if you are on the 96th trade, and you lose trade 96, 97, 98, 99, and 100, this would constitute a 5-streak loss. However, what if instead, you lost trade 96? It is now impossible to have 5 losses in a row starting from trade 97 and ending at trade number 100. This small example shows that finding this type of probability is a lot harder than it looks.
It’s funny because when I started this series, I wasn’t expecting to go this in-depth into statistics but every solution I found had questions that needed answers. And as more questions piled up the further the rabbit hole I went into mathematical statistics. Now, to find the most accurate way to solve this, from my understanding, you need what’s called a Markov Chain. A Markov Chain is a mathematical system that describes a sequence of possible events in which the probability of each event depends only on the state attained in the previous event. This type of system is then used in a coding language in order to calculate the probability of consecutive losses within a sample size.
Losing Streak Probability Chart
I believe I have found a loss streak calculator that possesses the most accurate form of this. I manually incorporated each number into the below charts.

One thing to note is that as we stretch our sample size larger and larger (from 100 to 500, 500 to 1000) the realm of possibilities for clusters of good and bad luck becomes more prevalent. That is why there is a higher chance of the same loss streak happening within larger samples.
50% Win Rate

With a 50% loss streak, it is certain that you would have a …
Loss streak of at least 2 with 100 trades.
Loss streak of at least 4 with 500 trades.
Loss streak of at least 5 with 1000 trades.
25% Win Rate
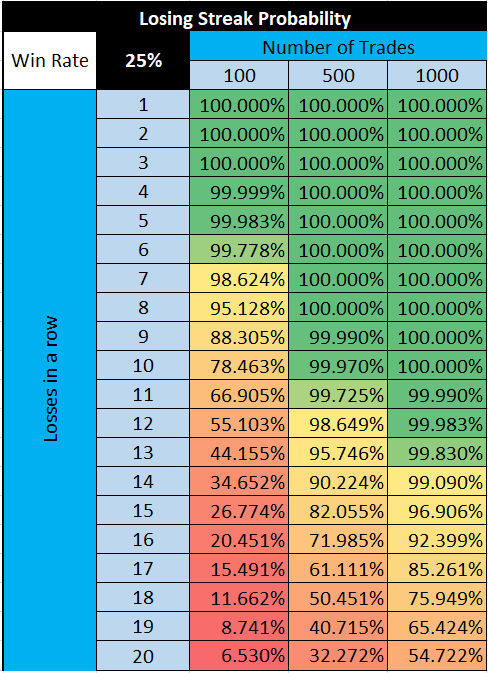
With a 25% loss streak, it is certain that you would have a …
Loss streak of at least 3 with 100 trades.
Loss streak of at least 8 with 500 trades.
Loss streak of at least 10 with 1000 trades.
Of course, the lower the win rate the more likely you are to have longer losing streaks. But you can see that the loss streaks become significantly longer the lower the win rate and the higher the trade size. For a low win rate, high winner (home run) trading strategy, this type of win rate can be seen as realistic for most. These long losing streaks are part of the course when using a home run style system and one must be prepared, or at least, understand that this will happen within their career.
Comparing with Losing Streak Probabilities (Part 1)

As you can see, these probabilities are dramatically different from the ones in my previous post, where the probability of consecutive losses is equal to the number of trades.
Using my previous post, “C) Losing Streak Probabilities (Part 1)” (Left chart), the probability of having 5 losing trades at a 50% win rate is 3.13%. Again, this is the chance of making 5 trades and all 5 trades are losses. Using the chart on the right, the chance of having at least 5 consecutive losses within a 100 trade span is 80.45%. Within a span of 500 and 1000 trades, it becomes increasingly definite that you will experience a 5-streak loss within that trade size.
Comparing with the Expected Losing Streak Value

I wanted to also compare my post “B) Expected Losing Streaks” to see how the expected losing streak compares to the probabilities associated with each “number of trades” category. Comparing the 50% win rate charts you can see that….
100 Trades = ~7 expected loss streak
500 Trades = ~9 expected loss streak
1000 Trades = ~10 expected loss streak
100 Trades = The probability of 7 losses in a row is 31.65%
500 Trades = The probability of 9 losses in a row is 38.46%
1000 Trades = The probability of 10 losses in a row is 38.53%
All three trade size samples (100, 500, 1000) have probabilities that indicate that the “expected losing streak” will likely be seen within each instance. I believe a deeper analysis needs to be done on this to validate further the expected loss streak formula used but for now, it seems appropriate and fair to use as a proxy.
One thing I learned after writing about probabilities of losing streaks is that it is way more complex than meets the eye, even when simplifying certain variables. Although I do think as a trader this level of understanding is good to have, with any further depth we enter the realm of obscurity and theoretical perspectives that I don't think would help anymore.
Estimating Using Excel
I found a really interesting post by
from The Trader Resource Hub which does an excellent job approximating loss probabilities using Excel. If done through Excel, it won’t be as accurate as using a calculator that uses Markov Chains but it will be close enough to give you a visual of what to expect if you want to create larger-scale charts.Conclusion:
To some up, statistics is hard and I will be leaving the more complex stuff to people way smarter than me.
As a trader, know that long-losing clusters will occur!
-F4VS
References:
Why Trading Forex is so Difficult - Randomness in the Markets: Clusters of Bad and Good Luck - This is an interview with Dr. David Paul where he talks about good and bad luck when it comes to trading. And the mental attitude that is needed when clusters of bad luck inevitably occur. This is the reason why I wanted to start and dig further into this topic so I hope you enjoy the video as much as I did.
Markov Chain - A mathematical system that is used in losing streak calculators to give the most accurate of calculations.
Tools:
Loss Streak Calculator - From my understanding, this will have the most accurate calculation of a loss streak.