
Understanding the Importance of Level 2 and Time & Sales Data
Understanding L2 & T&S data can give a true advantage to an intraday trader; here's how...

Index:
Level 2 Data Series
Understanding the Importance of Level 2 Data
The Mystery Behind Level 2 Data - Strong/Weak Tape & Spotting Hidden Participants
Real World Application of Level 2 Data
As I research intraday setups, Level 2 becomes a prevalent theme. A theme where most prominent traders will say that it is almost a necessity to use. I thought I would try to get a grasp of what Level 2 is and hopefully document almost every concept that I could find on the topic.
For an overview of Level 2 and Time & Sales data, see Why Inexperienced Traders Disregard Level 2 Data
Now let’s get into why L2 is so important…
Why Is This Important?
First, I think you get a true advantage from L2 data. Now, obviously, if you are a long-term investor, this will not apply, but the shorter the holding period (ie. scalping or intraday plays) the more important L2 becomes.
Understanding L2 & Time and Sales data will (if you can learn it) provide a deeper insight into the supply and demand dynamics of a stock, which can help in making more informed trading decisions. Here's why it matters…
Visibility into Market Depth
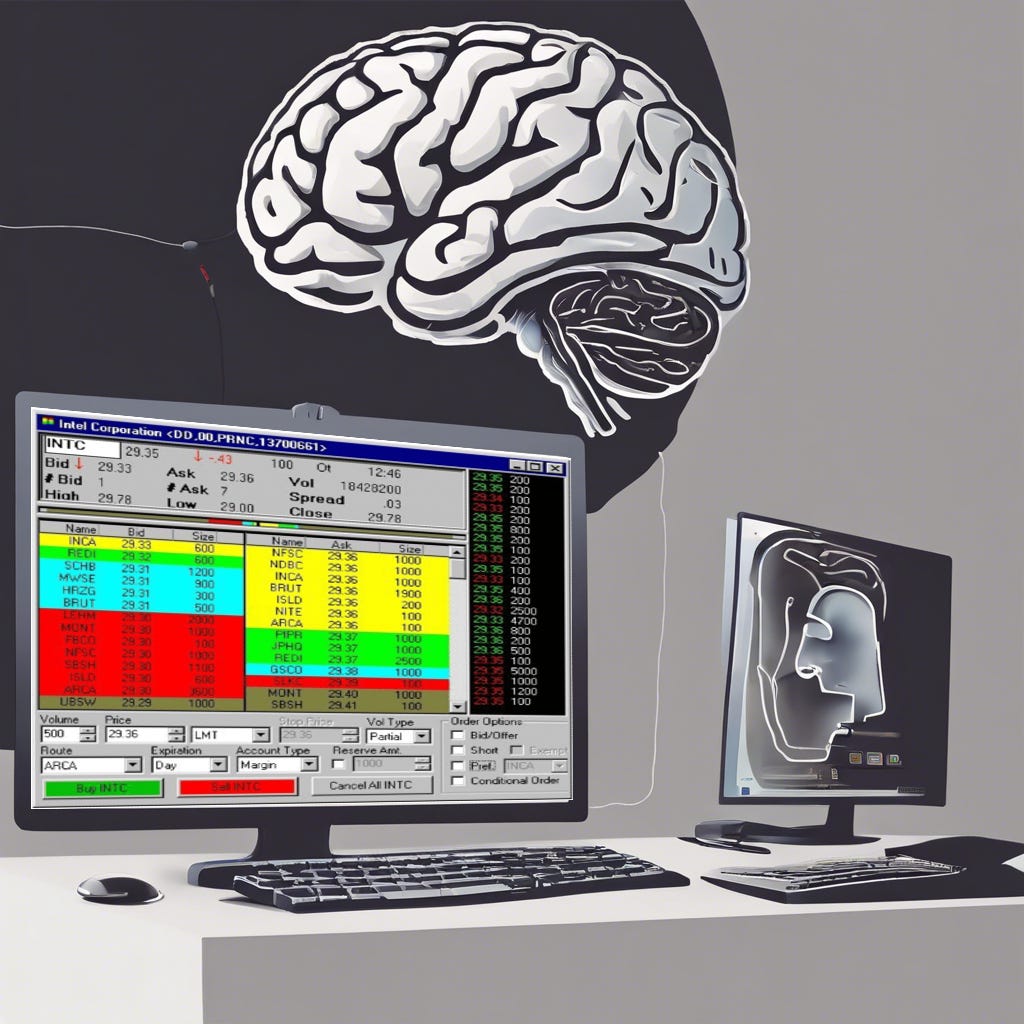
L2 displays a detailed view of the order book, showing not just the current best bid (buy order) and ask (sell order), but also the prices and sizes of orders waiting at various levels above and below the current market price. It provides traders with information on:
Liquidity - how easily an asset can be bought or sold without causing a significant price movement.
High liquidity means there are enough buyers and sellers at various price points to facilitate smooth transactions, while low liquidity means that even small trades can cause significant price changes. By examining the number of shares available at different price levels, traders can assess how much liquidity exists in the market. For instance, if there are large buy or sell orders at multiple price points, it indicates a highly liquid market, meaning traders can execute their trades with minimal slippage (the difference between the expected and actual price of a trade). If the order book looks thin with very few orders at various price levels, the market may be illiquid, which could lead to higher slippage or difficulty entering/exiting positions without moving the price. Now if you're trading a few hundred shares, this doesn’t really matter, but what if you're trading 1000 shares or 10,000 shares or 100,000 shares… Now liquidity is important.
Example of high liquidity on Level 2. Note that Sz in this example is the Number of shares in 100 units. Therefore 249 on the bid at 14.14000 is actually a pending limit order by a buyer for 24,900 shares.

Order Flow: How much demand or supply exists at different price points.
Order flow refers to the direction and volume of market orders—whether buy orders (demand) are dominating or sell orders (supply) are. L2 shows how much buying or selling pressure exists at different price levels, giving traders a real-time sense of whether the market is more bullish or bearish. (In later posts I will go further into this). Basically, this visibility can be used to assess potential price movements based on where large orders are stacked, giving clues about support and resistance levels.
In this example “Size” is not divided by 100 shares. This picture indicates the exact share size.

Identify Market Sentiment
Similar to Orderflow, L2 allows traders to observe the imbalance between buy orders (bids) and sell orders (asks), which provides a picture of current market sentiment. This imbalance can be an indicator of potential price movements.
Bullish Sentiment:
When large buy orders dominate the bid side, it suggests strong demand for the stock, signaling bullish sentiment. This is often an indication that prices may rise as buyers are willing to purchase at increasingly higher prices. Traders who recognize this may anticipate an upward price movement and position themselves accordingly.
If buy orders are being filled quickly and the bid side continues to replenish with even larger orders, this suggests strong buying momentum. Traders might interpret this as a sign of an imminent price breakout and go long (buy in).
Going back to this example, we see huge orders on the $700 price level. With very thin asks. Now, if sellers start eating away at that large size, without orders being replenished, it could be that sellers are taking over.
Bearish Sentiment:
Conversely, if large sell orders dominate the ask side, it signals bearish sentiment—a potential decline in price. Sellers may be eager to offload shares at lower prices, suggesting an oversupply or weakening demand. This can prompt traders to sell or short-sell the stock in anticipation of a price drop.
If the ask side is consistently absorbing sell orders and growing, it indicates strong selling momentum, prompting traders to exit their positions or initiate short trades.
By monitoring these shifts in sentiment, it’s possible to predict which side of the market (buyers or sellers) is gaining strength. For instance, if you see the bid side growing rapidly with large buy orders, you might bet on a price rally.
The next post will go over the complexities of order absorption really understanding the mechanics behind buyer and seller pressure.
Confirmation of Price Movements
L2 can act as a confirmation tool for technical analysis. If a trader identifies a breakout level on a chart, seeing large buy orders on the bid side of Level 2 at that breakout point can provide confidence that the breakout will hold. Likewise, if the order book thins out beyond a certain level, it might signal a false breakout.
Identifying Support and Resistance Levels
L2 can help identify potential support and resistance levels in the market by observing where large buy or sell orders are sitting in the order book.
Going back to the original example. We see support on the bid at $700. Remember, in order for the price to move lower, sellers would need to eat up that size before moving lower and that is a lot of size compared to the ask! Therefore, if price action is showing support at $700, L2 can be another confirmation of that $700 price level.
Summary
Understanding L2 can provide real-time insight into the underlying supply and demand forces. Again there are many topics I have touched on but now that we have a good understanding of why L2 and T&S is important, we can get into the nitty gritty of things. And then how to actually apply it to trades!
-F4VS

References:
YT Video: Level 2/Tape reading 101 Webinar, by TheShortBear
Highly recommend watching this webinar! It will give you a good starting framework.
YT Video: The Ultimate Level 2 Guide For Complete Beginners, by Live Trading by TraderTV Live
YT Video: How To Read Level 2 Market Data
Blog Post: Level 2 Quotes – How to Read Market Depth Chart [Videos]
Blog Post: Level 2 Tip: Know Your Market Makers