


Creating a Market ETF Dashboard on Google Sheets - Sectors
Building out a Market ETF Dashboard. The goal; to deliver a a broad overview of the market to develop further insights

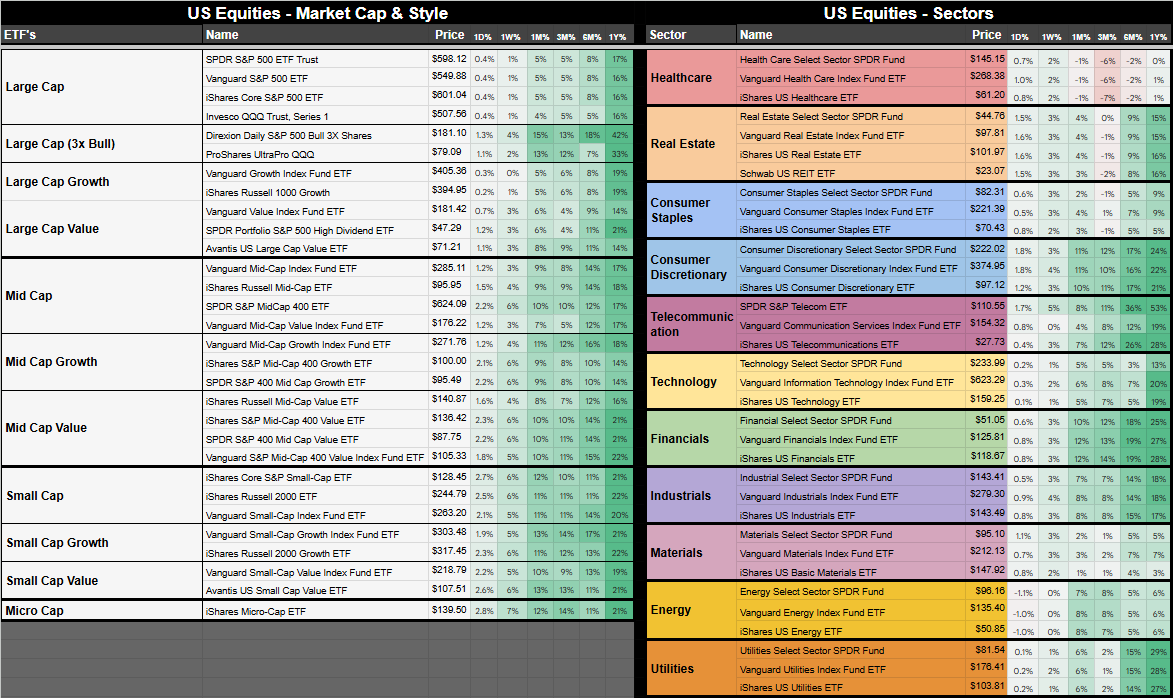
I added sectors to the Market Dashboard (MD). As the MD progresses more segments will be added. As we continue, the themes and industry segments will probably be the most exciting as they will be useful in identifying new themes that emerge! But that will be in the coming posts.
The columns to the right of the price column are 1D%, 1W%, 1M%, 3M%, 6M%, 1Y%.
1D% = Day Percentage Change
1W% = Week Percentage Change (5 days)
1M% = Month Percentage Change (21 days)
3M% = 3 Month Percentage Change (63 days)
6M% = 6 Month Percentage Change (126 days)
1Y% = Year Percentage Change (252 days)
Each of these cells are conditionally formatted. For example:
Percentages close to 0% will not have a color
Percentages farther from 0% will be colored with green (if positive) and red (if negative) with darker hues the further from 0% you go.
I know there are probably better ways to display this and I know Jeff Sun from
has a really great way to show relative strength that I will add later on, but for now, I think this does the job.Stick around and chat
If there are any recommendations and segments you would want me to add to the Market Dashboard, please let me know by leaving a comment. If you just want to say Hi, you can do that too! 😊
Downloading the Google Sheet
For Paid Subscribers, a link to the current Google Sheet can be found below. However, if you don’t want to pay, every post will have a screenshot of the current MD so that you can create your own. For reference, I used VettaFi’s ETFDB site to help me understand all the ETF segments that are out there. And over time as new ETFs are created, I will continue to add to the dashboard.
Link to ETF Dashboard below! 🔽
For the full experience, upgrade your subscription. Share Retail Trader’s Repository for rewards. When you refer a friend, or click the “Share” button on any post, you'll get credit for any new subscribers. Even the free ones! For a Database of 104 historical stock setups that highlight key momentum trends, specifically targeting Breakouts and Catalyst Gappers, click the button below.
Link to Google Sheet, below:
Keep reading with a 7-day free trial
Subscribe to A Retail Trader's Repository to keep reading this post and get 7 days of free access to the full post archives.