
How to Collect Data to Gain an Edge
Art of Data Collection: A Step-by-Step Guide for New Traders

I recently watched a video where a famous trader talks about his approach to collecting data and using this data to build out a database to determine a bias. For some reason, this video clicked with me and the approach that he took! As I look for more intraday plays, I started to create this

But as I work through it, I wanted to give a more clear guideline and thoughts on how I am approaching it and how to replicate it as a new trader.
Start with a Definitive Event
In order to start tracking a setup you need an idea. It starts with having an idea you have about the market, that could be something you read in a trading book, hear in a video, or see within the market.
But really, what do I mean by a “definitive” event?
Well, let’s say you wanted to track the idea that a technical double-top pattern will result in the price of the stock declining. Sure this could be a possible setup but there is a lot of ambiguity to this idea. What types of stocks would you want to track; small caps, large caps, stocks that have low or high floats, stocks that are below a certain price? Not to mention the ambiguity in tracking the actual pattern. Are you going to distinguish between the exact price hitting? If not, and the price on the second touch of the top, moves past the first high by a few points, what then will you track… Maybe a percentage range?

My point here is the more you think through the details of tracking a more vague setup the harder it gets. And it’s already hard to try to think through what should and shouldn’t be tracked because of how many variations and complex nuances there are. And for someone with analysis paralysis (like myself) about everything they do, this is not the way to go!
So instead of getting bogged down in details, you need to start with a definitive event; one that is clear and is known. This can be biotech stocks getting a patent approved, a company issuing new shares, or in my case, what I am tracking, a stock gapping in price by over 20% and breaking premarket highs in the morning. After you have your idea you want to go from broad to narrow to avoid the complexity first because… you don’t know what you don’t know.
Now there are 1000s upon 1000s of stocks that have exhibited this behavior in the past. This is why…
Filtering is so Important

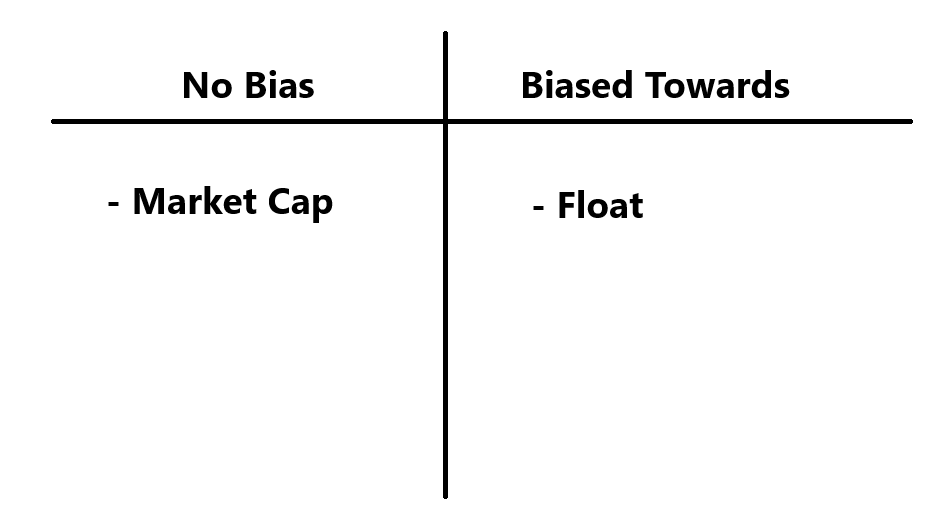
Remember there should be a reason why you filter out stocks from others. In my case, I used a low float filter of stocks that have had a float of 100M or less. Why low float stocks, well because you want a stock that makes big moves in price (at least for me). And low float stocks will generally do that.
What about price or market cap… what about this or that… that’s normally the thoughts that pop into my mind now but that is the wrong approach. Maybe that doesn’t matter because of the float. A stock can be a mid-cap but still be low float, so do we really need to worry about that right now; not really. I also want to bring up the fact that the “float” criteria filter might not be the best way to do this but again you have to start somewhere. And as you consume more trading material, this can be adjusted and refined.
The Hard Part
After you have your idea and a definitive event to track, now comes the hard part. What do you measure to figure out how a similar stock will behave in the future?
Screentime! Which means looking at 1000s and 1000s of stock charts, which will translate to questions for you to then answer!
Let’s use my example of a low float stock gapping in price by over 20% and breaking premarket highs in the morning as a reference. As I look at stocks that acted in this way in the past, questions start to form…
Questions that have come up:
Do both float and market cap matter with this setup?
Having a low float matters significantly because it increases the chance the price will move dramatically. However, the market cap is a little different because you can have a stock with a tiny float but be a mid-cap stock… so what then? Well to me it seems like it doesn’t matter that the stock is a mid-cap if it made such a significant move because all I care about is that the stock moved. Now another question that comes out of this is generally larger market cap companies will have more analyst coverage and because of that, it could be the case that because more analysts and eyeballs are on the stock, it will be less likely to make that setup. In a way, this could be true, but there have been a handful of mid-cap low float stocks that make big moves so for now let’s just use the criteria of only tracking stocks that have a low float (ie. less than 100M float) and be agnostic on market cap.
Does after-hours/ premarket volume matter with respect to this setup?
This one is a bit harder, but overall it depends. We want a stock to have volume for a few reasons:
The stock will have a higher probability of moving significantly
We have key areas that can be traded off of
Narrowing of the spread, meaning we have less slippage
I know I am probably missing a few reasons, but I think you get the point.
The threshold I chose was having a premarket volume of over 1M. For me, this seems like this would satisfy all of my reasons. Again, this filter can be lower or higher on what you believe in and prefer but for me, 1M shares makes sense. Also, if I am not seeing any previous setups because of how narrow this filter is I can lower my PM volume threshold! Remember, it’s a work in progress. I am here to ask questions, answer them, and continue this process until an edge is found… Bit by bit.
Does the formation of the candlestick matter in the setup?
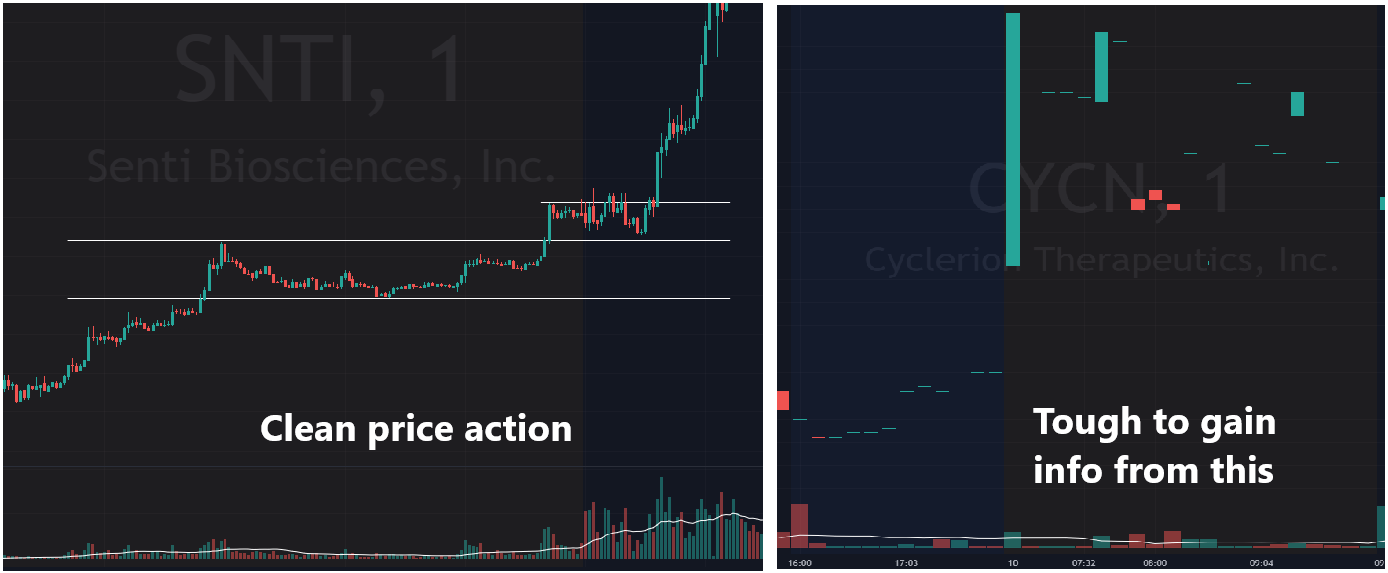
You will have questions that don’t make sense. In this case, as I get more screen time reviewing past charts that exhibited this pattern, I came to the realization that this is a silly question to ask because really this doesn’t matter. What I should be looking at is when does the stock hit its high of the day, not that the candle pattern really matters because it doesn’t tell you relevant information that can be used. But the only way to know this is by doing the repetitions, seeing chart after chart, the similarities and differences.
Also, I am not saying price action doesn’t matter with entering/ exiting/ risk management. Just that when collecting data, we want clear data points. As you expand your database you can add more subjective data points that have maybe a yes or no filter on them.

Making Mistakes
An example of where I made a mistake that wasted 30 minutes of my time. Instead of tracking the premarket high price, I decided to just track wether the the setup had an after-hours high or a pre-market high. Instead, I could have just tracked the premarket high price and got rid of this pretty useless data point. But the reason I did this was because I wanted to know if I could distinguish the setup from it having an after hours high vs. a pre-market high. (It didn’t really matter)
This may sound like a no-brainer and maybe it is a little bit but sometimes you forget and kind of go with things and something doesn’t click until you look at it over and over and you come to that realization that what I was doing was actually not the most optimal.

So as you gain more experience and view more historical charts with the same pattern, you can start answering the questions that you will have.
I believe building out a database and forming a bias to understand the probabilities of the setup is the first step to moving from a beginner trader to a novice.
For now, happy trading and hope this helps!
-F4VS
Stick around and chat
If you have any thoughts on the post, please leave a comment. If you just want to say Hi, you can do that too! 😊
For the full experience, upgrade your subscription. Share Retail Trader’s Repository for rewards. When you refer a friend, or click the “Share” button on any post, you'll get credit for any new subscribers. Even the free ones! For a Database of 104 historical stock setups that highlight key momentum trends, specifically targeting Breakouts and Catalyst Gappers, click the button below.