Goverdhan Gajjala: Trading Methodology & Setups - Setup #1: Bull Flag Breakout (Part 2A)
A Summary on Goverdhan Gajjala's Trading Methodology & Setups - Setup #1: Bull Flag Breakout (Part 2A)
Index:
Goverdhan Gajjala: A Deep Dive into the Momentum Access Masterclass (Part 1)
Goverdhan Gajjala: Trading Methodology & Setups (Part 2)
Setup #1: Bull Flag Breakout (Part 2A)
This is a 3-part series on Goverdhan Gajjala's free Momentum Access Day Trading Masterclass. Currently, Goverdhan Gajjala (GG) announced he was going to discontinue services due to health issues. But hopefully, these posts can help to give more clarity on his methodology and systems.
The second part of this series will be broken down into multiple subparts. This is because if I included all the examples for each setup in one post, it would be a 50-minute read and would have 100 different charts. Separating each setup into individual posts will hopefully allow traders to explore, evaluate, and experiment with the described setup and create an open discussion.
Each subpart will go through the specific setup that GG uses with key examples displaying what an optimal setup would look like to him as well as some invalid setups.
If you are interested in his method of trading you can visit ….
Link to X Account: @gov_gajjala
Trading Strategies: Setups & Case Studies
GG uses 5 different types of bullish setups that he named. These are:
Setup #1: Bull Flag Breakout
Setup #2: EMAs Kiss and Fly
Setup #3: Horizontal Fade
Setup #4: Intraday Volatility Contraction Pattern (VCP)
Setup #5: Reversal Squeeze
Each setup builds on top of the next one. Each of the 5 setups focuses on bullish momentum therefore GG uses the same type of exit strategy for almost all of them.
Exit Strategy → Sell partial shares (1/4 to 1/2 of the position) after the initial push and trail the remaining position with a stop loss. Using an EMA as a trailing stop or when you expect that the trend is over/ showing weakness.
Setup #1: Bull Flag Breakout (Classic Pullback)
Characteristics
At least 2 big green bars with gradual price and volume increases. This could be on the 1-minute, 5-minute, or 15-minute chart
The next few bars consolidate around the top price action with low-volume bars.
Entry
Should be at the high of the previous pulled-back bar and stop loss at the low of the bar.
This setup will happen FAST and will only allow for a few minutes of time to make a decision (depending on the timeframe that it is traded on)
Bull Flag Breakout Examples:
VCIG 0.00%↑ - 5 Minute Chart
In PreMarket (PM)
Uptrend and respecting the EMAs
The continuation is sideways with low volume
Market Open
Demand picks up with greater price action with small pullbacks
#1 → 3 large green bars showing a big swing in price with a correspondingly large volume increase
#2 → the brief pullback hangs at the top of the previous green bar with relatively small volume. The 2nd pullback bar (green) is the entry bar.
After Entry
If showing strength, wait as you want your winners to run
If price action is hesitating or going sideways, take partials into the strength. This is also impacted by current account value and progressive exposure principles
Ie. If in a drawdown, as soon as trade goes into profit direction, take partials (half of the size for example) and lock in profits and have a trailing stop for the other half or will buy further into strength again if showing another possible setup.
It is about capturing the big meat of the move, as you don't want to time the highs as it could result in the trade reversing.
If the move is as strong as this $VCIG move, he will peel off slowly to try to capture the majority of the move
LIFW 0.00%↑ - 5 Minute Chart
Price and volume increase at the open, then…
#1 → 3 large green bars with large gradual increases in volume
#2 → 2 bars of pull back with lower volume.
Entry → Uses the 2nd pullback inside bar (green) as the entry bar
Note, in situations where the high points of the pullback bars (#2) are close to each other and you want to be more cautious, entry could be at the high of the 1st red pullback bar and the stop loss being the lowest of the 2 pullback bars
BRSH 0.00%↑ - 5 Minute Chart
This pattern also occurs in premarket
If the trade is acting how the setup was intended, (like $BRSH) he will take another entry if the chart allows it, therefore trying to add more size if it’s a continuation into strength
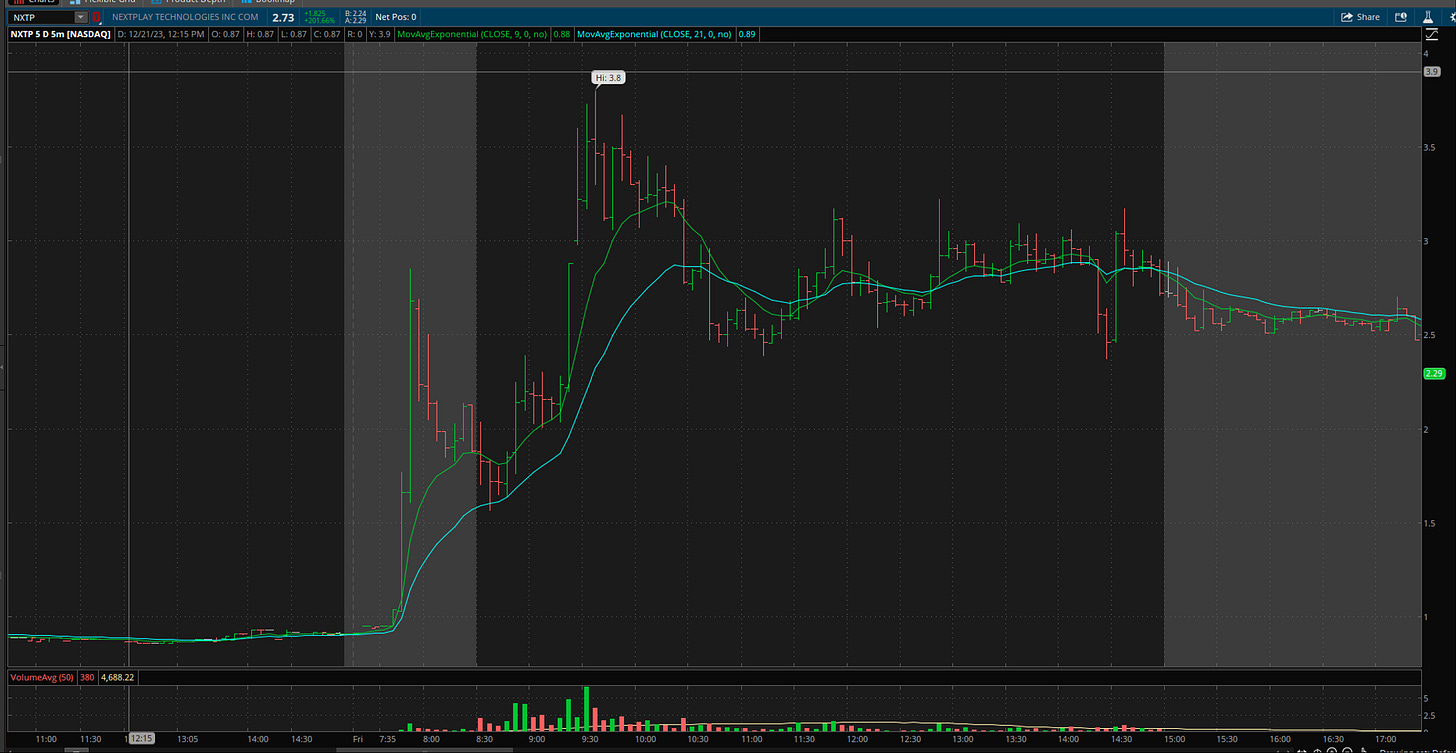
NXTP 0.00%↑ - 5 Minute Chart
This setup just like every setup will have variations. This variation can be very similar to Setup#2: EMA Kiss & Fly. Remember each setup will ultimately build on each other.
Market Open:
Again, 3 bars of price increase with gradual volume increases
The 3rd bar is not as favorable as it gave back almost all of its price and has less volume
Pullback:
Took 4 pullback bars of sideways action before the rip in price
After the Entry - High of $3.8:
Take off half the position when showing weakness, which was on the red high of the day bar of $3.8.
Trail the remaining position with a 9EMA
DWAC 0.00%↑ - 5 Minute Chart
Must Remember: setup works if the stock is in an uptrend. (as you can see, EMAs are up trending, and sloping upward)
If the pattern is showing in a downtrend, it is NOT valid
Entry → Pullback shows small volume. The 2nd red pullback bar’s high is the entry.
This would be considered a very favorable setup. This is because, if you see a base setting up and breaking, and then the setup forms, the probability of success is generally higher from GG’s experience.
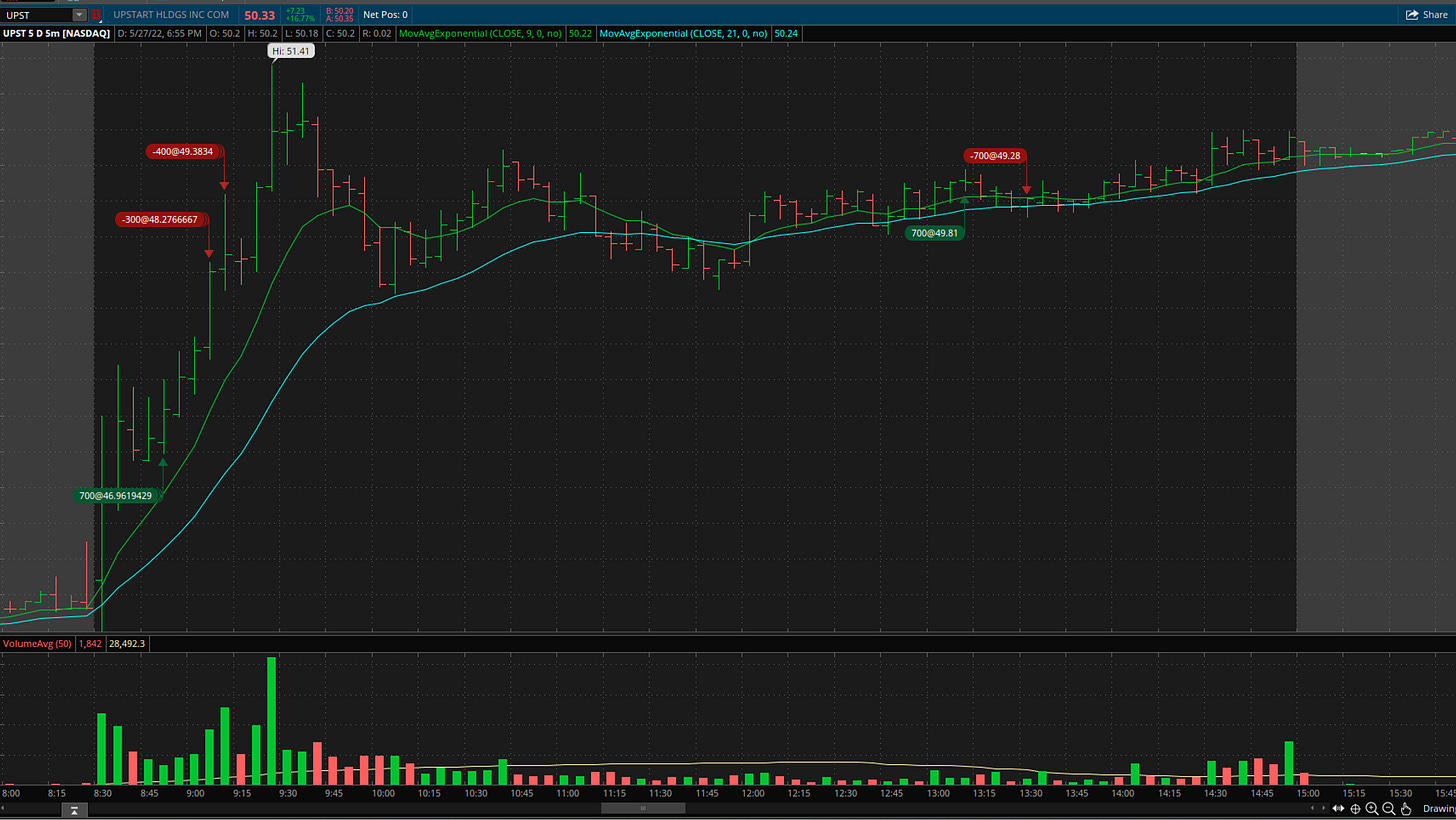
UPST 0.00%↑ - 5 Minute Chart
Market opens with 2 strong candles
This setup differs from RKDA (see invalid setups below) because the pullback bars remained at the top of the last strong green candle and took time before making the move to the upside.
One point that Goverdhan doesn’t mention that I think could be a factor, is that RKDA’s move was mid-day (assuming from positive news). UPST had large demand at market open and had some uptrending movement in PM, which could have a higher probability chance than a scenario like RKDA.
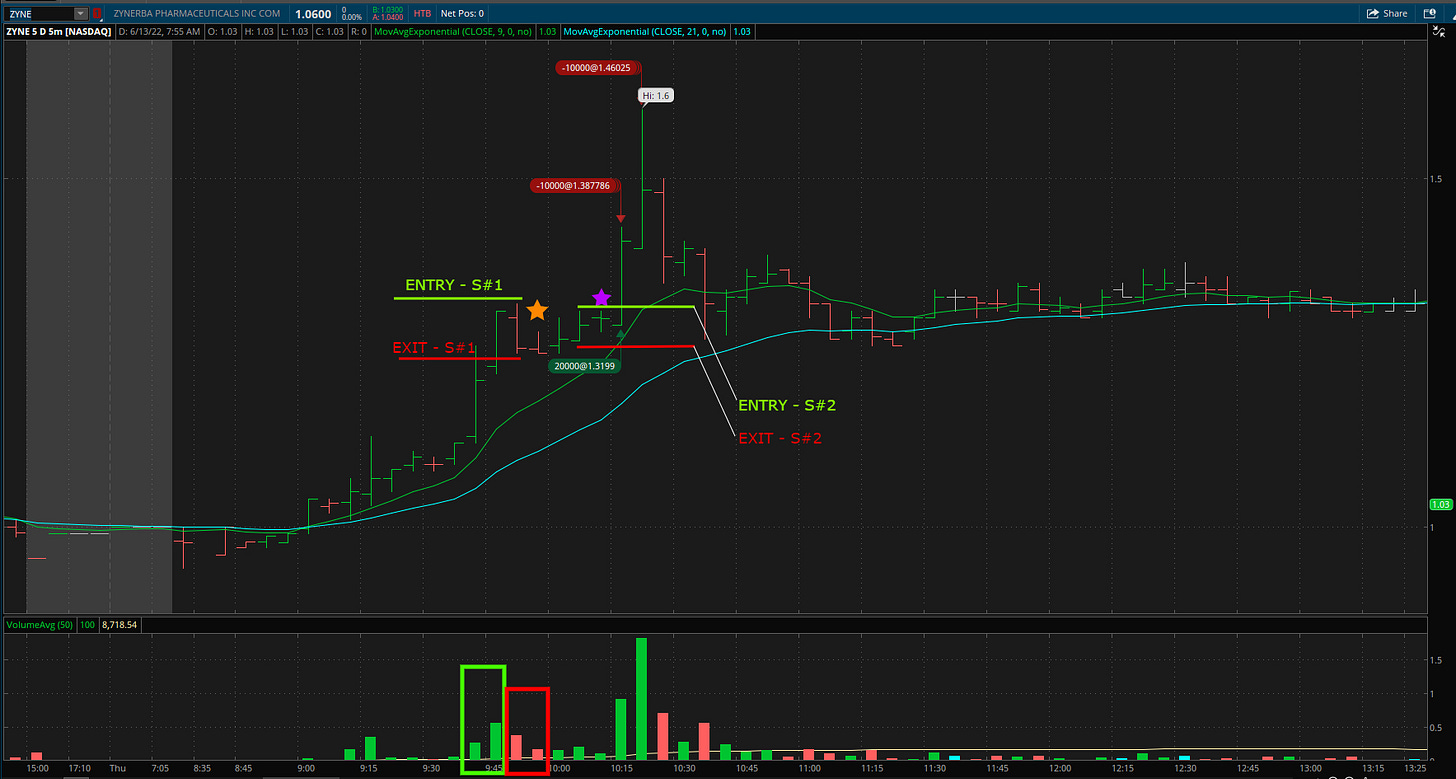
ZYNE 0.00%↑ - 5 Minute Chart
2-3 up bars with a gradual increase in volume
5 pullback/ sideways bars before breaking out
Another example of where the entry could have been on the second red pullback bar, Setup#1: Bull Flag Breakout, depicted as S#1… but using Setup#2: EMA Kiss & Fly (explained in an upcoming post) depicted as S#2, entry could have been at the EMA touch.
EHTH 0.00%↑ - 5 Minute Chart
SECO 0.00%↑ - 5 Minute Chart
After-hours setup. A ~100% move in 45 minutes.
At any point in time, there could be (for example) a new research catalyst that starts the uptrend
In the “Invalid Setups” section (below), the RKDA setup looks very similar to this. I think what qualifies this SECO 0.00%↑setup is the gradual nature of the move versus the violent move of RKDA. That said, both setups could technically work, but the probability of working will be lower on RKDA.
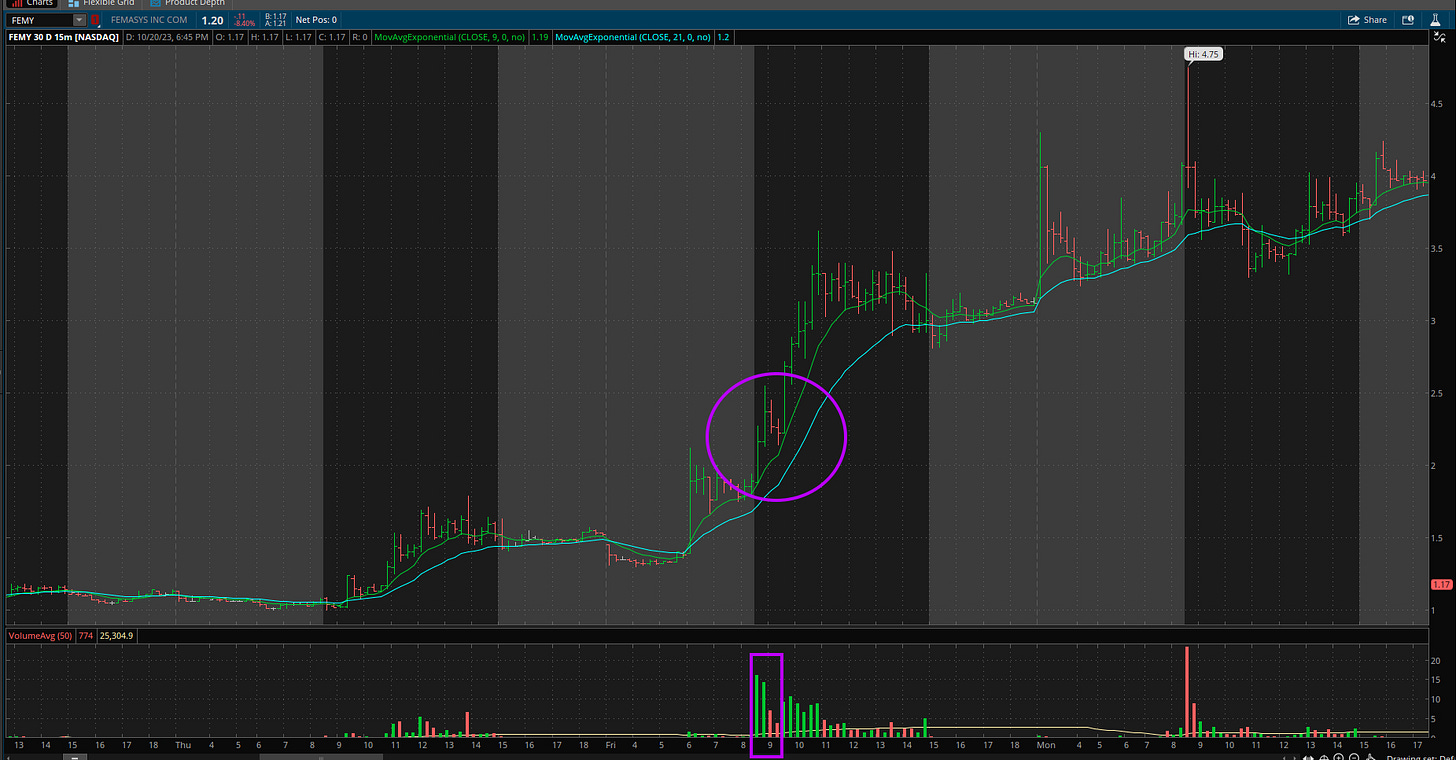
FEMY 0.00%↑ - 15 Minute Chart
This setup can also be seen on the 15-minute chart
OPGN 0.00%↑ - 5 Minute Chart
Another after-hours play
INVALID SETUPS
RKDA 0.00%↑ - 5 Minute Chart
INVALID SETUP
This trade was in his early days of trading
Looking back it is NOT an ideal Bull Flag Breakout setup. Because…
There is no clear uptrend in price, only these 2 sudden large green bars, but that does not qualify as an uptrend.
The first pullback bar gives back too much of the move and should be more so at the top of the 2nd green up bar.
The trade still worked out in the end, but the momentum died out quickly.
NVCT 0.00%↑ - 5 Minute Chart
INVALID SETUP
This was a trade he took in his earlier days when he was learning, as he would think everything was a bull flag
In my early days swing trading breakouts, I can very much feel this sentiment of seeing most things as the pattern you are looking for, and it took me a lot of time (still mess up) to train my brain to not overfit the setup to the chart I am looking at
Only one large big green candle with the pullback giving up a lot of the move
OCX 0.00%↑ - 5 Minute Chart
INVALID SETUP
The volume for the green up bars should be GRADUAL! It shouldn’t be this big of a jump.
Having 2 or 3x the volume of the previous candle is fine, having 10x the volume should be avoided
The pullback volume bar (red arrows) is very large compared to the green up bars. Not good!
For all readers who made it to the end, thank you!
-F4VS

