Goverdhan Gajjala: Trading Methodology - Setup #3: Horizontal Fade (Part 2C)
A Summary on Goverdhan Gajjala's Trading Methodology & Setups - Setup #3: (Part 2C)
Index:
Goverdhan Gajjala: A Deep Dive into the Momentum Access Masterclass (Part 1)
Goverdhan Gajjala: Trading Methodology & Setups (Part 2)
Trading Strategies: Setups & Case Studies
GG uses 5 different types of bullish setups that he named. These are:
Setup #1: Bull Flag Breakout
Setup #2: EMAs Kiss and Fly
Setup #3: Horizontal Fade
Setup #4: Intraday Volatility Contraction Pattern (VCP)
Setup #5: Reversal Squeeze
Each setup builds on top of the next one. Each of the 5 setups focuses on bullish momentum therefore GG uses the same type of exit strategy for almost all of them.
Exit Strategy → Sell partial shares (1/4 to 1/2 of the position) after the initial push and trail the remaining position with a stop loss. Using an EMA as a trailing stop or when you expect that the trend is over/ showing weakness.
Setup #3: Horizontal Fade
*Clarification: The term “fade” in this instance is not used in the same context as when a stock slowly decreases its price over a period of time. A “Horizontal Fade” in this case would be considered a longer-term intraday breakout setup where the price actions consolidate before breaking out.
Characteristics
Good demand with relatively less selling compared to buying. (Consolidating in a tight pattern)
Price goes sideways around the top of the highest price action, or goes down slightly with low red volume.
The selling decreases gradually and consolidates at the EMAs.
Price action should look as if the price wants to go higher if/when selling dries up
Entry:
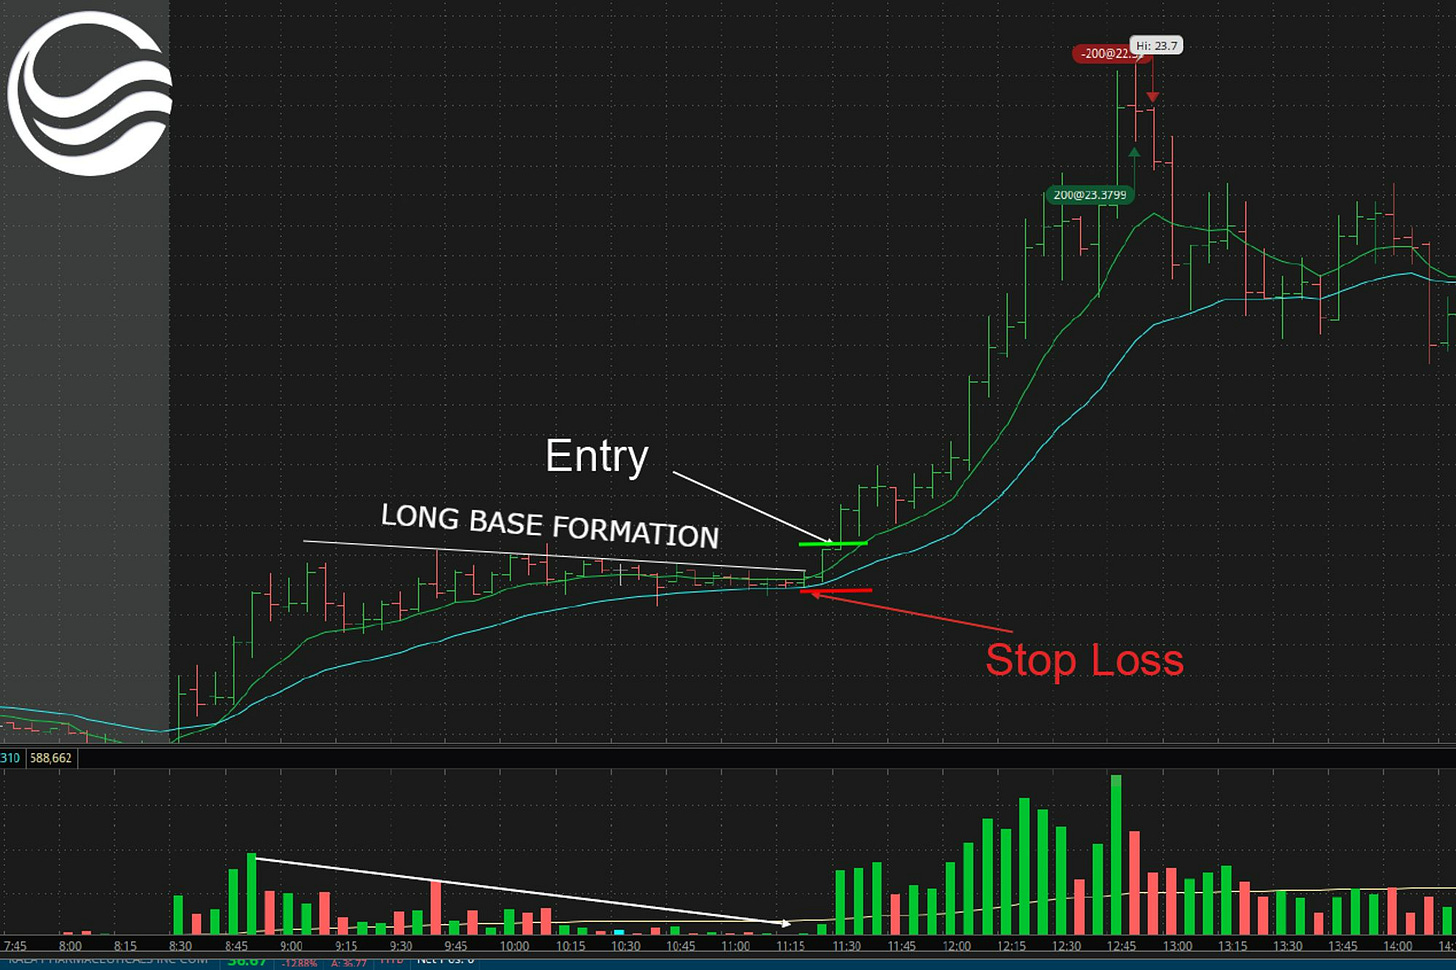
Uses the top of the initial consolidation as the entry point and the previous bars low as the stop loss. See below for a better visual.
This setup will have a larger base than S1 and S2, and normally the larger the base, the bigger the move!
One thing that should be noted. The Horizontal Fade, EMA Kiss & Fly, and the Bull Flag Breakout setups are all timeframe variants of the same type of momentum trade. The Horizontal Fade from the 30-15m chart, the EMA Kiss & Fly using a 5-15m chart and the Bull Flag Breakout on a 5-minute chart are roughly the same in essence. GG uses timeframes in a unique way that most don’t. He uses the timeframes to make the chart and setup work for him.
Horizontal Fade Examples:
AERC 0.00%↑ - 5 Minute Chart
Creates a long base with decreasing volume.
Respects the 9EMA then hits the 21EMA where both EMAs meet
KALA 0.00%↑ - 5 Minute Chart
There are 2 entries in this stock and this could be a way to size further into the position on the second base.
PALT 0.00%↑ - 3 Minute Chart
APLD 0.00%↑ - 15 Minute Chart
Price climbs higher with slowly declining volume.
Once selling dries up, demand pushes the price further up.
HKD 0.00%↑ - 5 Minute Chart
Large base!
QNRX 0.00%↑ - 5 Minute Chart
PXMD 0.00%↑ - 5 Minute Chart
MEGL 0.00%↑ - 5 Minute Chart
Volume dries up completely, with touching of both EMAs, then starts to make the move
VVOS 0.00%↑ - 15 Minute Chart
MLGO 0.00%↑ - 5 Minute Chart
SPRB 0.00%↑ - 5 Minute Chart
INVALID SETUP
BWV 0.00%↑ - 5 Minute Chart
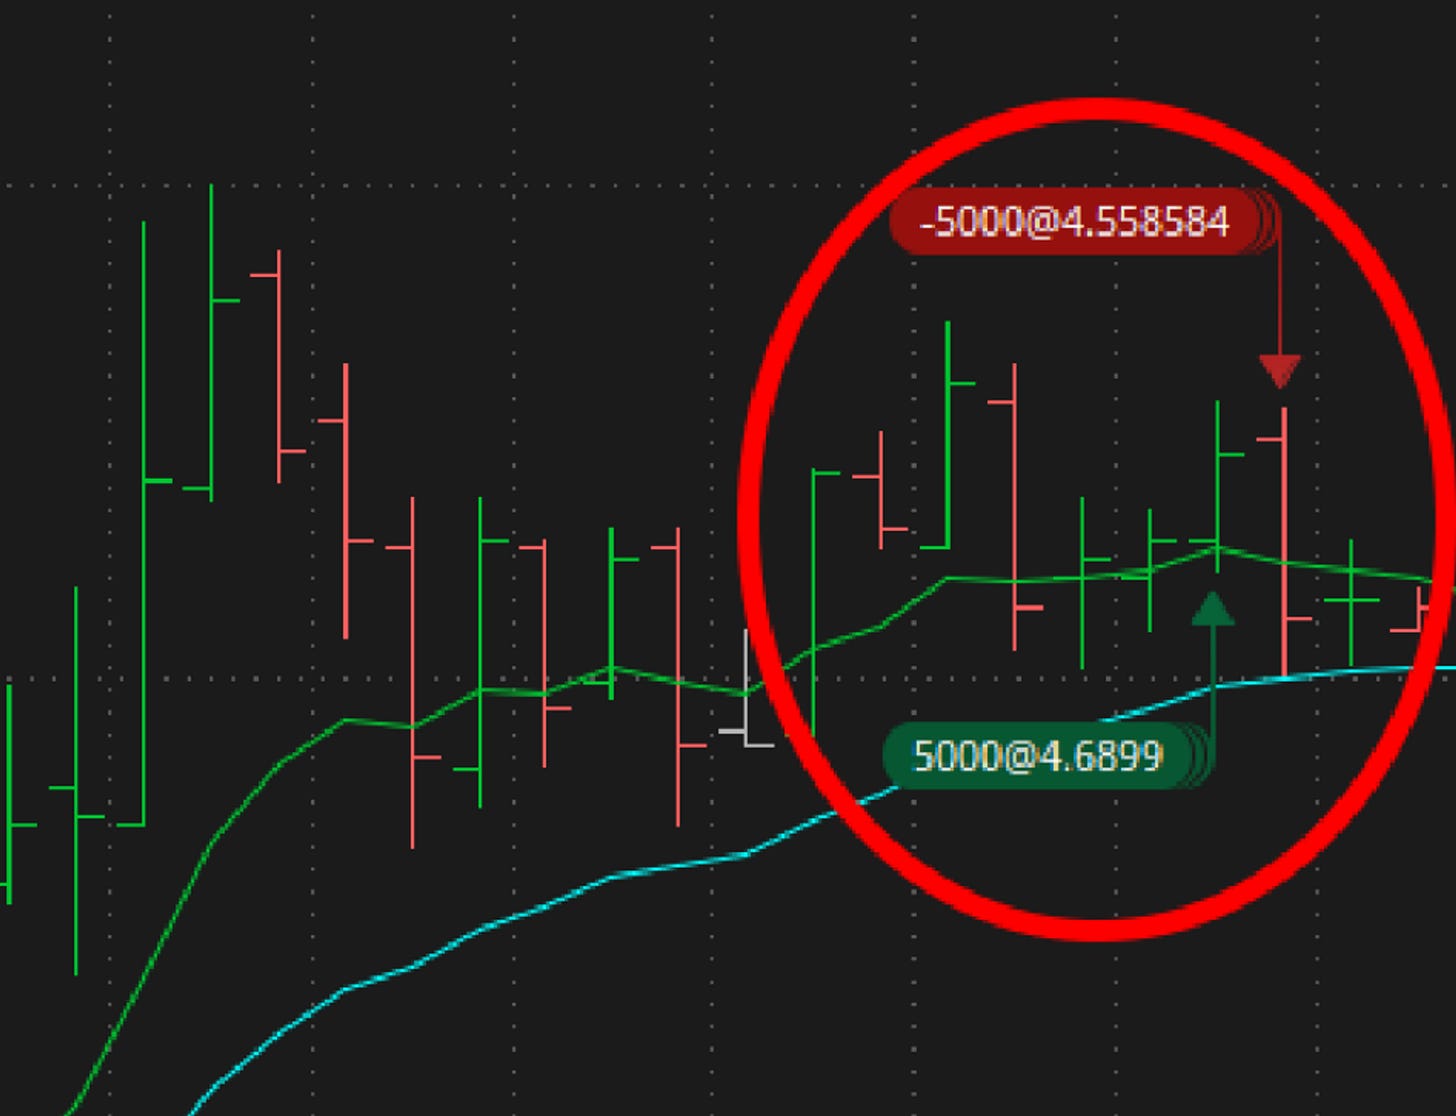
Impatience can result in entering a trade too early and being stopped out.
If you are interested in his method of trading you can visit ….
Link to X Account: @gov_gajjala


