Goverdhan Gajjala: Trading Methodology - Setup #4: Intraday Volatility Contraction Pattern (Part 2D)
A Summary of the Intraday Volatility Contraction Pattern setup that GG used to win the US Investing Championship!
Index:
Goverdhan Gajjala: A Deep Dive into the Momentum Access Masterclass (Part 1)
Goverdhan Gajjala: Trading Methodology & Setups (Part 2)
Setup #4: Intraday Volatility Contraction Pattern (Part 2D)
Trading Strategies: Setups & Case Studies
GG uses 5 different types of bullish setups that he named. These are:
Setup #1: Bull Flag Breakout
Setup #2: EMAs Kiss and Fly
Setup #3: Horizontal Fade
Setup #4: Intraday Volatility Contraction Pattern (VCP)
Setup #5: Reversal Squeeze
Each setup builds on top of the next one. Each of the 5 setups focuses on bullish momentum therefore GG uses the same type of exit strategy for almost all of them.
Exit Strategy → Sell partial shares (1/4 to 1/2 of the position) after the initial push and trail the remaining position with a stop loss. Using an EMA as a trailing stop or when you expect that the trend is over/ showing weakness.
Setup #4: Intraday Volatility Contraction Pattern (VCP)
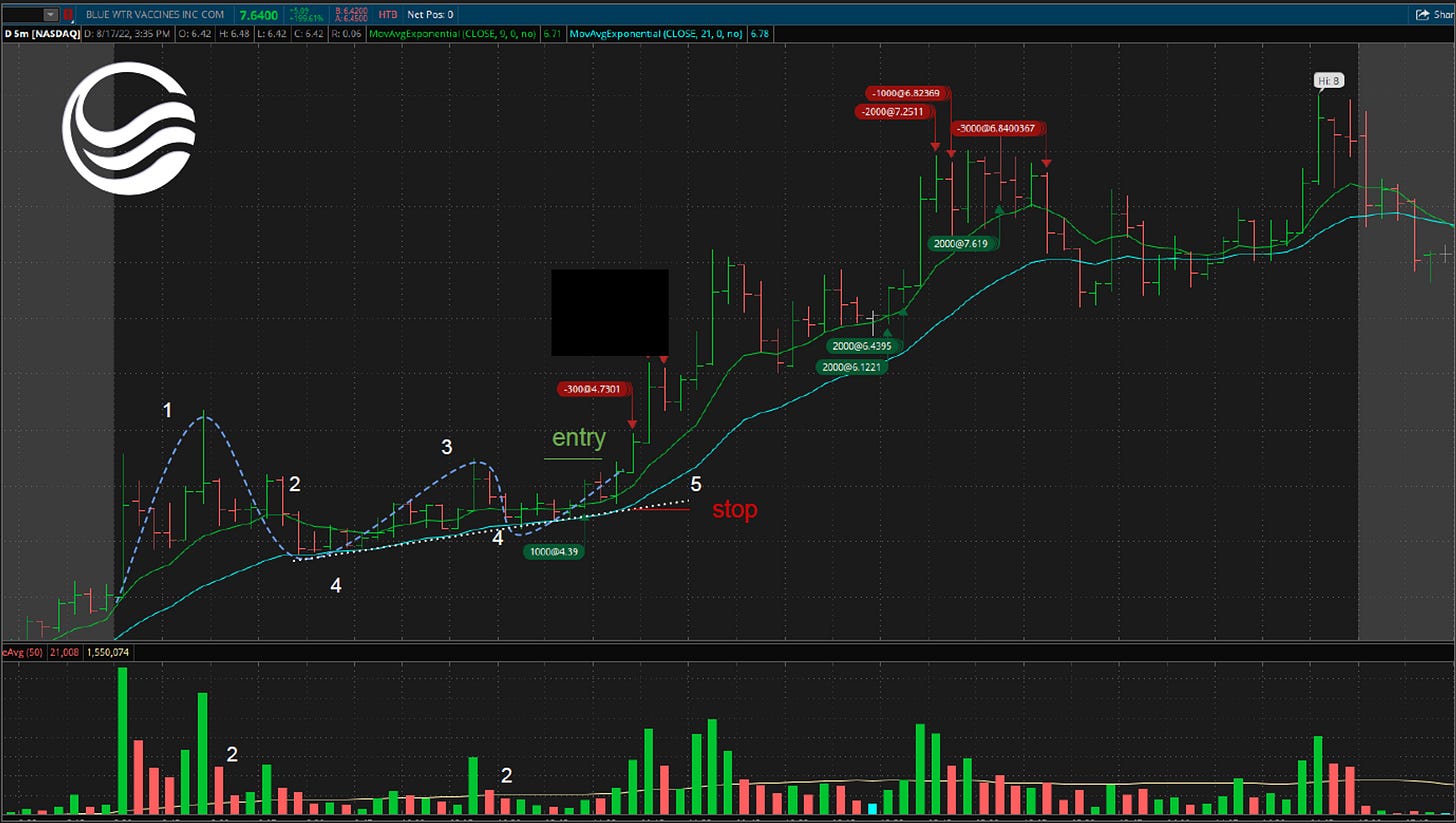
Characteristics
Good demand in 1 bar or a couple of bars
The price comes back almost to the original level (fades) with low volume
Demand tries to pick up but sells off
The price finds support at the 21 EMA
The trend should have higher lows
While “Setup#1: Bull Flag Breakouts” is his fastest setup, Intraday VCPs are his slowest setups
One other thing to consider. I think the Horizontal Fade and the Intraday VCP are incredibly similar to one another. The key difference though is 1/ how large the price waves are and 2/ the consolidation on the EMAs. The Horizontal Fade setup will have price respecting the 9EMA or a more shorter EMA vs the Intraday VCP where the 21EMA is respected.
Intraday Volatility Contraction Pattern Examples:
ELEV 0.00%↑ - 5 Minute Chart
Perfect definition of the setup - Would be classified as an A+
He uses the 9EMA as a trailing stop and tries to ride the wave of momentum until price closes below the 9EMA, therefore closing the trade
DWAC 0.00%↑ - 5 Minute Chart
Base on a base
The first entry was a mini VCP
PHUN 0.00%↑ - 5 Minute Chart
Micro VCP setup
SHOT 0.00%↑ - 5 Minute Chart
SIGA 0.00%↑ - 5 Minute Chart
BWV 0.00%↑ - 5 Minute Chart
SHPH 0.00%↑ - 5 Minute Chart
Another micro VCP setup
A variation of the Intraday VCP setup, as there were still higher lows with the price respecting the 21EMA
SHFS 0.00%↑ - 5 Minute Chart
CFVI 0.00%↑ - 5 Minute Chart
DWAC 0.00%↑ - 5 Minute Chart
NVVE 0.00%↑ - 5 Minute Chart
INVALID SETUPS
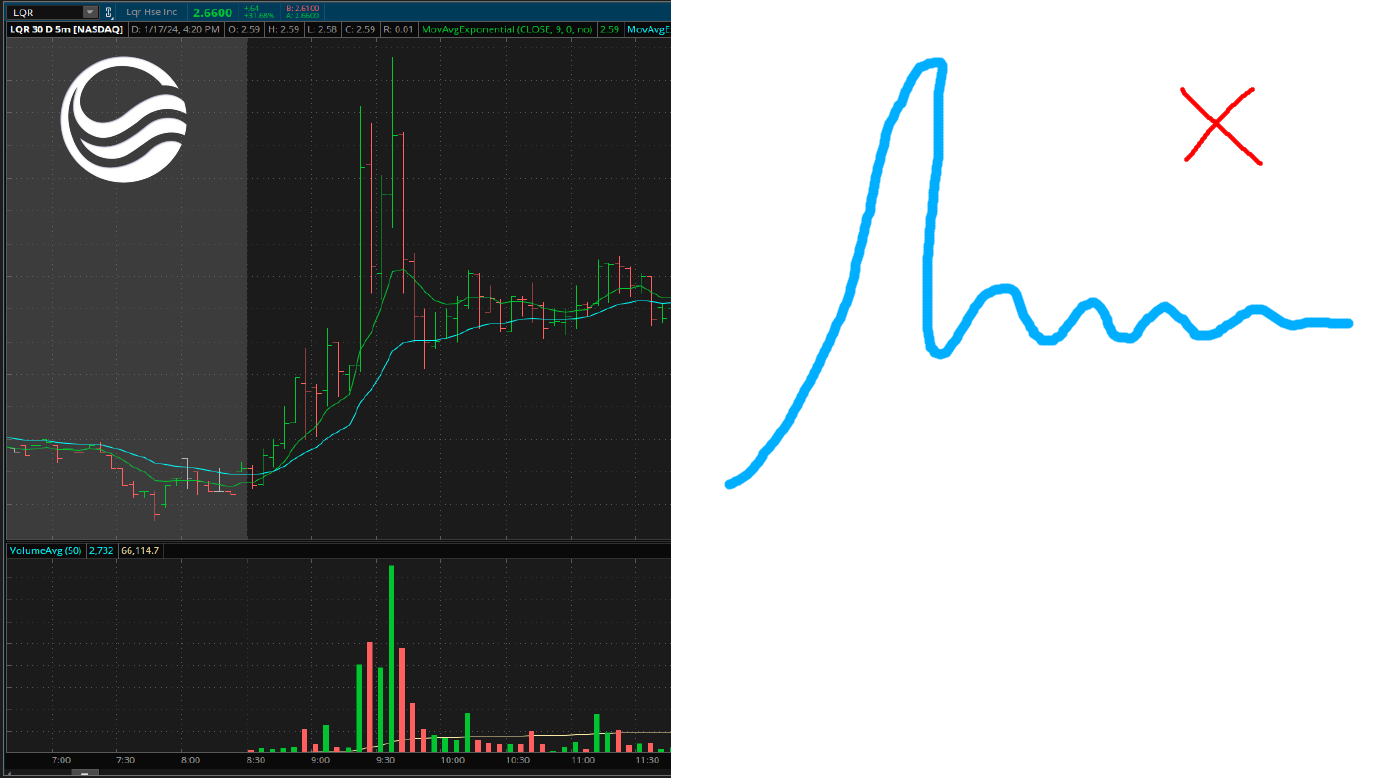
The key to understanding the main violation of this setup vs what to look for would be something like this (excuse my drawing):
You want symmetrical price movement after the initial push in price. When consolidation starts the first leg up should flow into the consolidation. It shouldn’t look choppy, like how it does on the right side of the picture.
LQR 0.00%↑ - 5 Minute Chart
Characteristics Missing In This Setup:
2/ The price comes back almost to the original level (fades) with low volume
The leg-up doesn’t flow into the consolidation.
4/ The price finds support at the 21 EMA & 5/ The trend should have higher lows
The initial demand is too violent and the consolidation although tight isn’t clean and symmetrical. Not an optimal setup.
Other Notes:
Too high of a volume spike and the selling is also too high after the main green bar
After the initial highs the price did not try to reclaim its high, the drop was too sharp of a move
AYLA 0.00%↑ - 5 Minute Chart
A deceptive chart! This could maybe been seen as good setup but for GG in hindsight, it had a pullback that was too sharp rather than fading a pullback with contractions.
This was a toughie!
BE 0.00%↑ - 5 Minute Chart
This chart is a more clear violation of the setup. See the big upswing into the violent downswing!
Volume showing very little demand
$MNRA - 5 Minute Chart
No clear initial uptrend/ leg up.
If you are interested in his method of trading you can visit ….
Link to X Account: @gov_gajjala


