Goverdhan Gajjala: Trading Methodology & Setups - Setup #2: EMAs Kiss and Fly (Part 2B)
A Summary on Goverdhan Gajjala's Trading Methodology & Setups - Setup #2: (Part 2B)
Index:
Goverdhan Gajjala: A Deep Dive into the Momentum Access Masterclass (Part 1)
Goverdhan Gajjala: Trading Methodology & Setups (Part 2)
This is a 3-part series on Goverdhan Gajjala's free Momentum Access Day Trading Masterclass. Currently, Goverdhan Gajjala (GG) announced he was going to discontinue services due to health issues. But hopefully, these posts can help to give more clarity on his methodology and systems.
The second part of this series will be broken down into multiple subparts. This is because if I included all the examples for each setup in one post, it would be a 50-minute read and would have 100 different charts. Separating each setup into individual posts will hopefully allow traders to explore, evaluate, and experiment with the described setup and create an open discussion.
Each subpart will go through the specific setup that GG uses with key examples displaying what an optimal setup would look like to him as well as some invalid setups.
If you are interested in his method of trading you can visit ….
Link to X Account: @gov_gajjala
Trading Strategies: Setups & Case Studies
GG uses 5 different types of bullish setups that he named. These are:
Setup #1: Bull Flag Breakout
Setup #2: EMAs Kiss and Fly
Setup #3: Horizontal Fade
Setup #4: Intraday Volatility Contraction Pattern (VCP)
Setup #5: Reversal Squeeze
Each setup builds on top of the next one. Each of the 5 setups focuses on bullish momentum therefore GG uses the same type of exit strategy for almost all of them.
Exit Strategy → Sell partial shares (1/4 to 1/2 of the position) after the initial push and trail the remaining position with a stop loss. Using an EMA as a trailing stop or when you expect that the trend is over/ showing weakness.
Setup #2: EMAs Kiss and Fly (Classic Breakout with EMAs)
Characteristics
Similar characteristics of the “Setup #1: Bull Flag Breakout” but with additional/ different criteria
The demand is good
The price pulls back organically
The volume reduces in the pullback
The price kisses EMA and respects it
Now, the entry should be at the top of the pulled-back bar and stop loss at the bottom of it.
After reviewing all the example setups one key difference between setups #1 and #2 is that even if the 1st pullback bar doesn't hold its price as long as it is showing consolidation while surfing and respecting the EMA it is valid.
I think this setup would be very similar to the Breakout setup that KQ uses but in an intraday version, at least pattern-wise.
EMAs Kiss and Fly Examples:
USEA 0.00%↑ - 5 Minute Chart
Let’s break down each characteristic with USEA.
#1. Good demand - 2 price-increasing bars with high volume
#2. The price pulls back organically
#3. The volume reduces in the pullback
#4. The price kisses EMA and respects it - The key criteria for this setup is that the price respects the EMA! Touches it and respects it
Based on how strong the price action is, sell partials into the strength.
If there is still an uptrend, you can use the 9 or 21EMA as a trailing stop loss and sell more partials along the way
Based on account value and progressive exposure principles, he will sell and close the trade accordingly.
If the trade is not moving in his direction, he will cut losses.
Remember → the setup requires an uptrend, therefore EMAs should be upward-sloping
BBBY 0.00%↑ - 5 Minute Chart
Hopefully this example for BBBY might give you a better visual of the type of setup and criteria to look for!
#1. Strong, steady, and continuous green bars with a gradual increase in volume
#2. Slow and gradual pullback in price
#3. Pullback has low volume
#4. Respects and touches the EMA
Again after the entry you want to sell partials into strength
This setup has the additional benefit of having more time to react to the price action as it’s happening, compared to the “Bull Flag Breakout” setup where you only have 10 to 15 minutes roughly (if using a 5m chart). This setup would allow for roughly half an hour of watching it before needing to enter
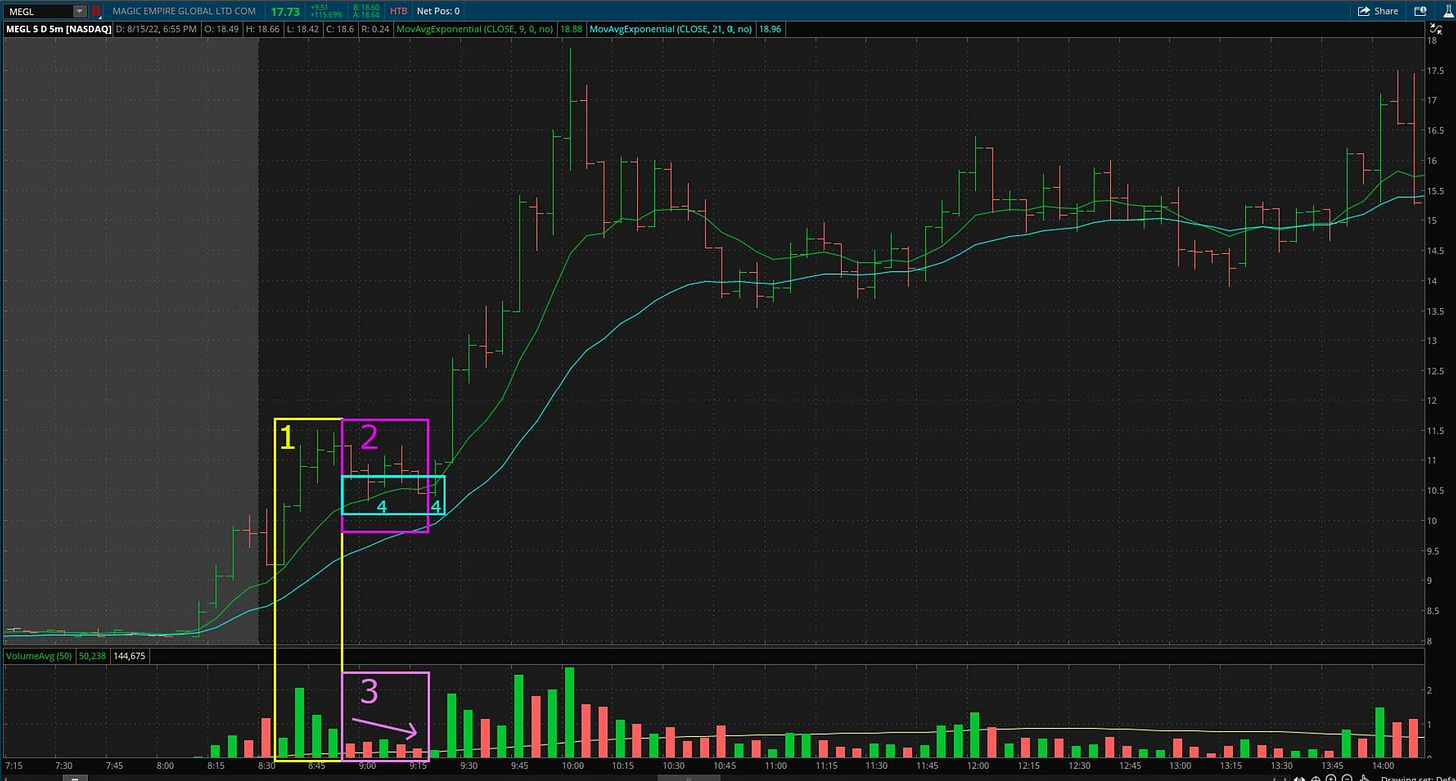
MEGL 0.00%↑ - 5 Minute Chart
Again let’s use the 4 criteria to visualize the setup.
#1. Strong, steady, and continuous green bars with a gradual increase in volume
#2. Slow and gradual pullback in price
#3. Pullback has low volume
#4. Respects and touches the EMA
In this scenario, depending on where you entered, you might have been close to being stopped out as it looks like after the 2 red pullback bars it shows a green bar before pulling back again. This trade would have worked but it would have been very close, depending on execution and timing. That said, looking at the Risk to Reward, even if you were stopped out this trade would have covered the lost trade and more!
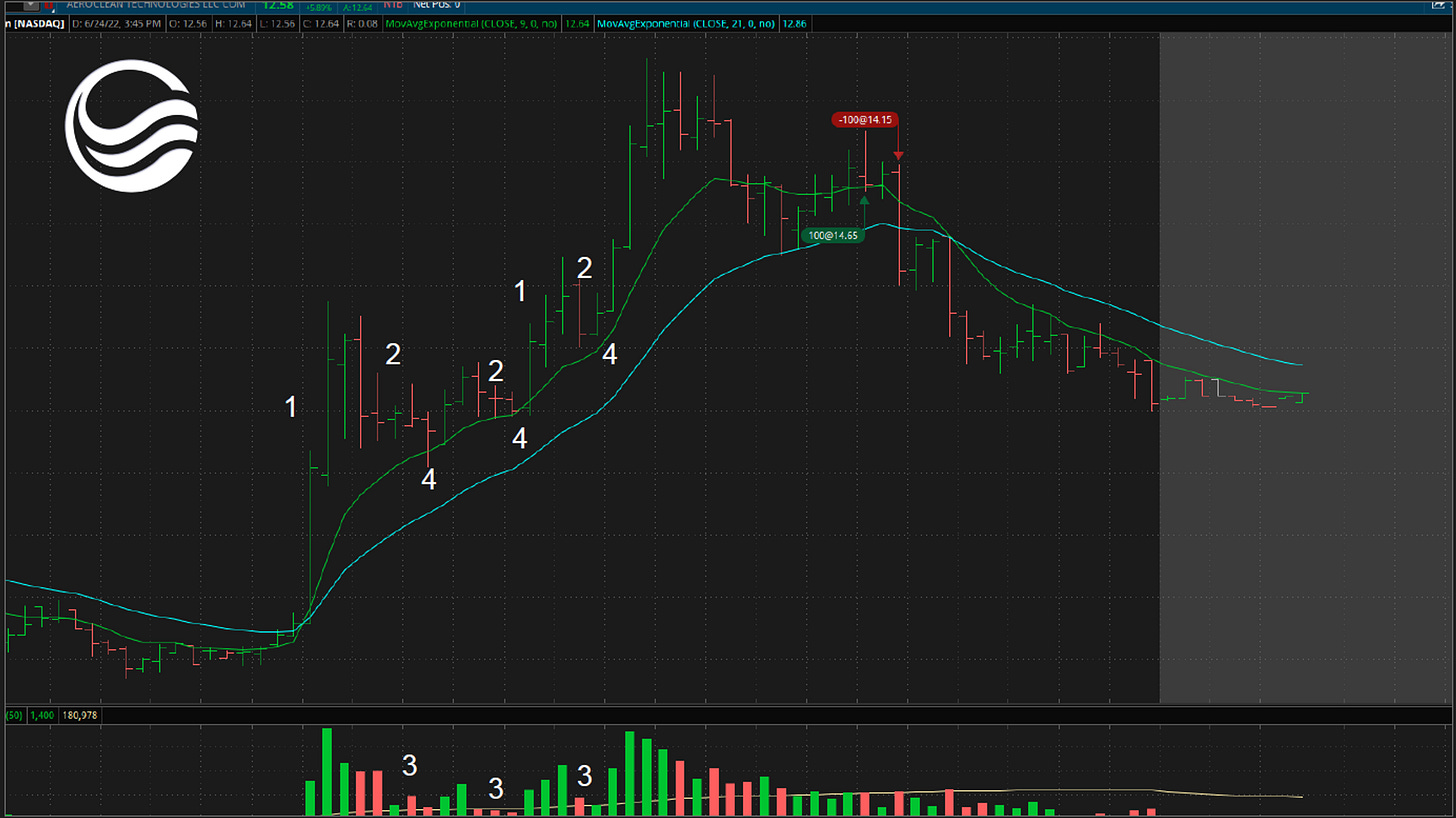
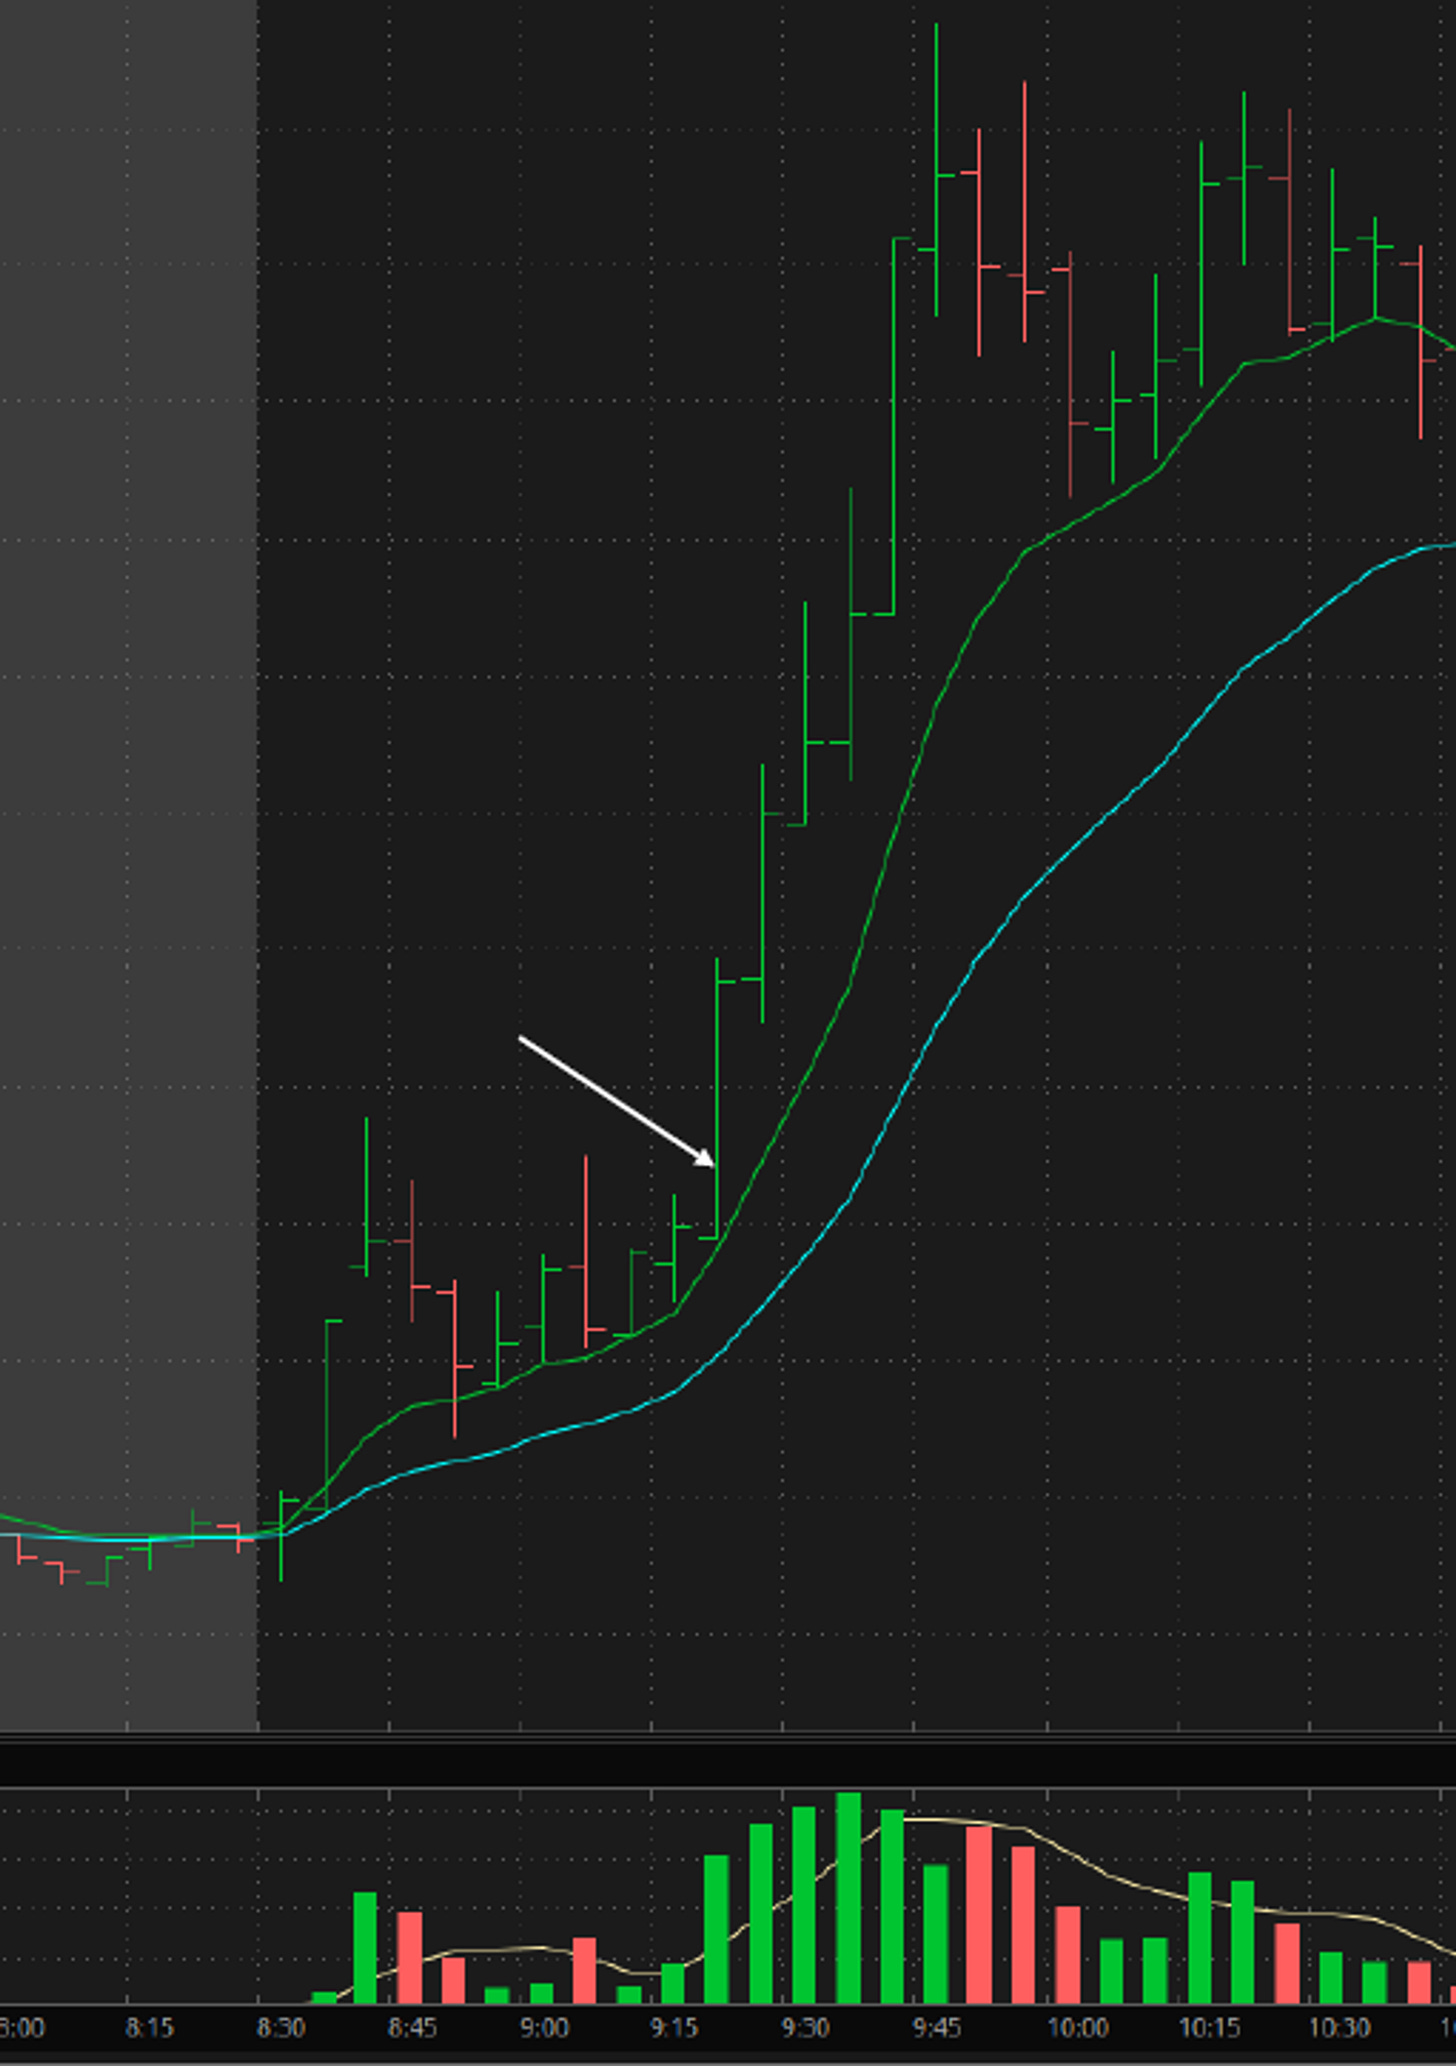
AERC 0.00%↑ - (#1) 5 Minute Chart
Base on top of a base
AERC 0.00%↑ - (#2) 5 Minute Chart
Creates a large base, with it surfing the EMA as it is forming. Even if you are unable to enter on the original base, at times, trades like these can offer multiple entries
NRDY 0.00%↑ - 5 Minute Chart
HKD 0.00%↑ - 5 Minute Chart
9 sideways bars with low volume - this gives you enough time to react and make the trade.
People do scalp trades or focus on shorter time frames, but having more time to see the formation occur and having more time to react can be a positive in most cases
SATX 0.00%↑ - 5 Minute Chart
GNS 0.00%↑ - 5 Minute Chart
Base on a base-on-base. There were multiple opportunities for entries on the base breaks. And with multiple bases and breaks, multiple opportunities to add further into the position.
One concept that GG uses is “Base Counting”.
After 3 bases, it will normally have a climax move and then gradually pullback.
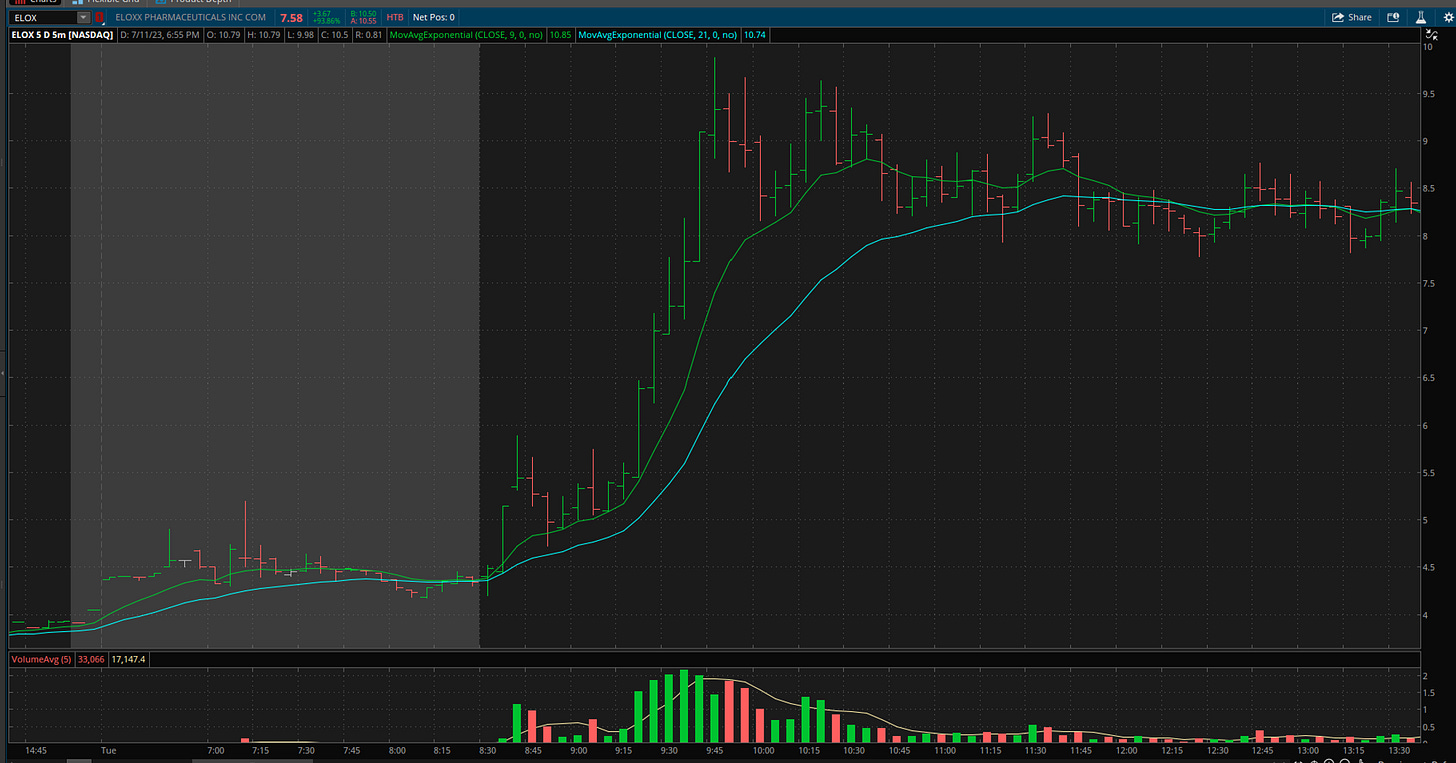
ELOX 0.00%↑ - 5 Minute Chart
TUP 0.00%↑ - 5 Minute Chart
ICCT 0.00%↑ - 5 Minute Chart
VFS 0.00%↑ - 5 Minute Chart
Another multi-base setup. He expected that when he sold that was the final climax run and exhaustion however, another base formed after that.
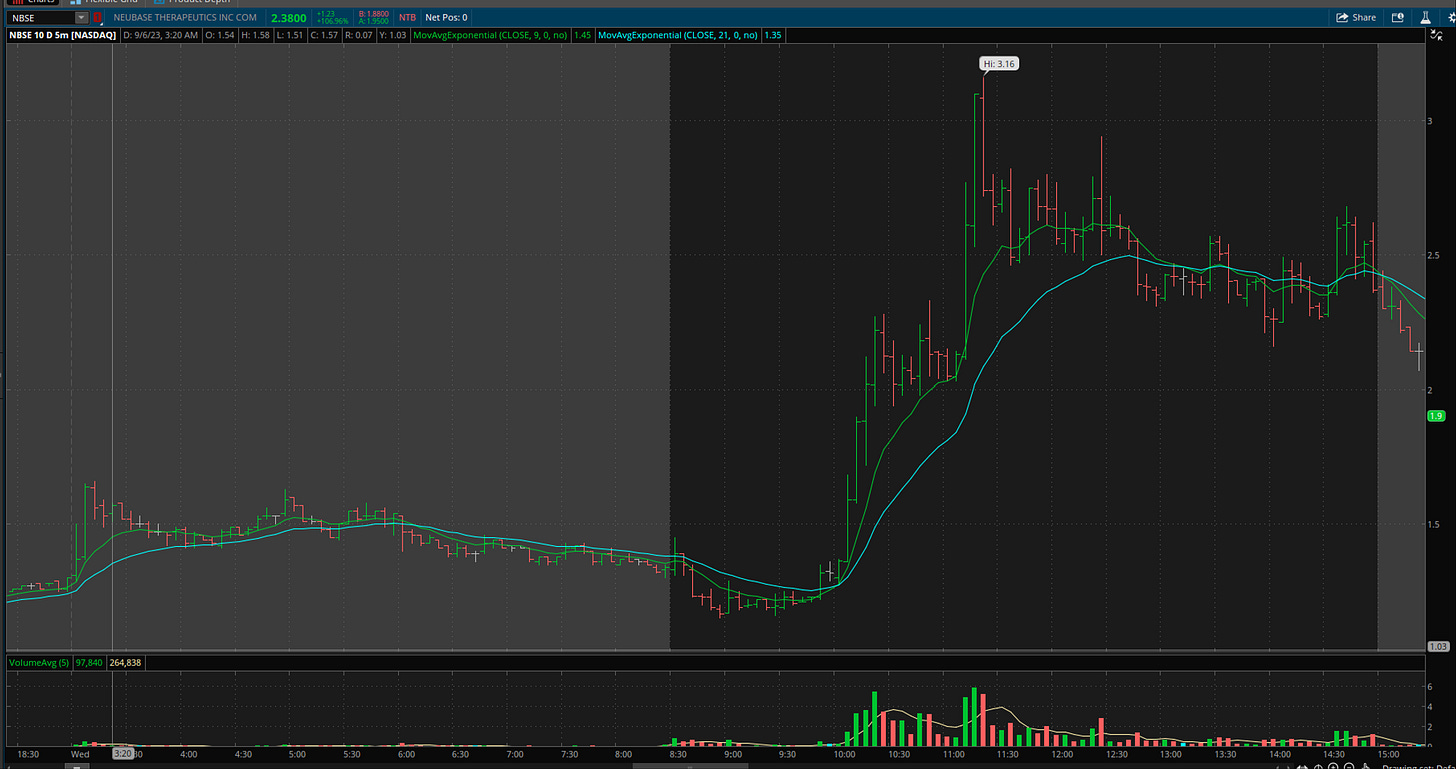
NBSE 0.00%↑ - 5 Minute Chart
BNOX 0.00%↑ - 5 Minute Chart
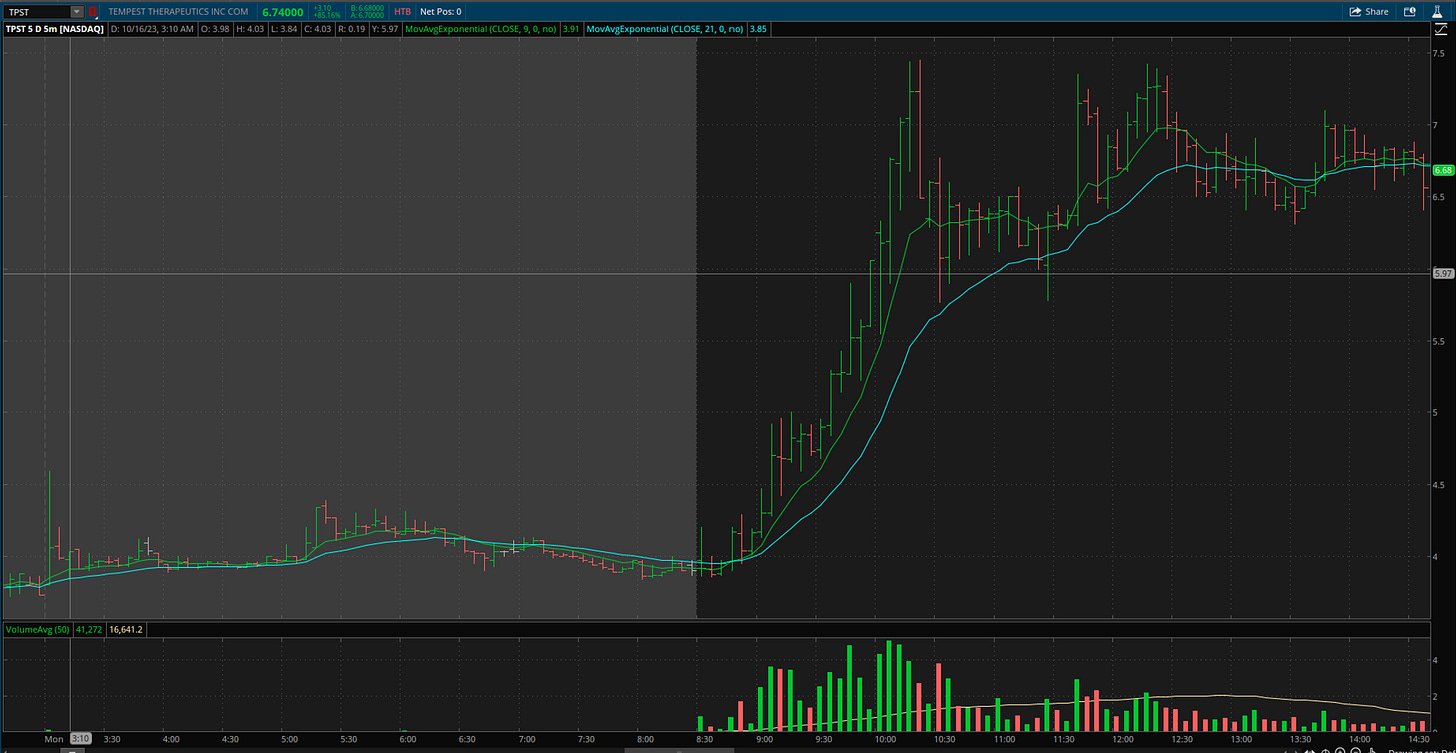
TPST 0.00%↑ - 5 Minute Chart
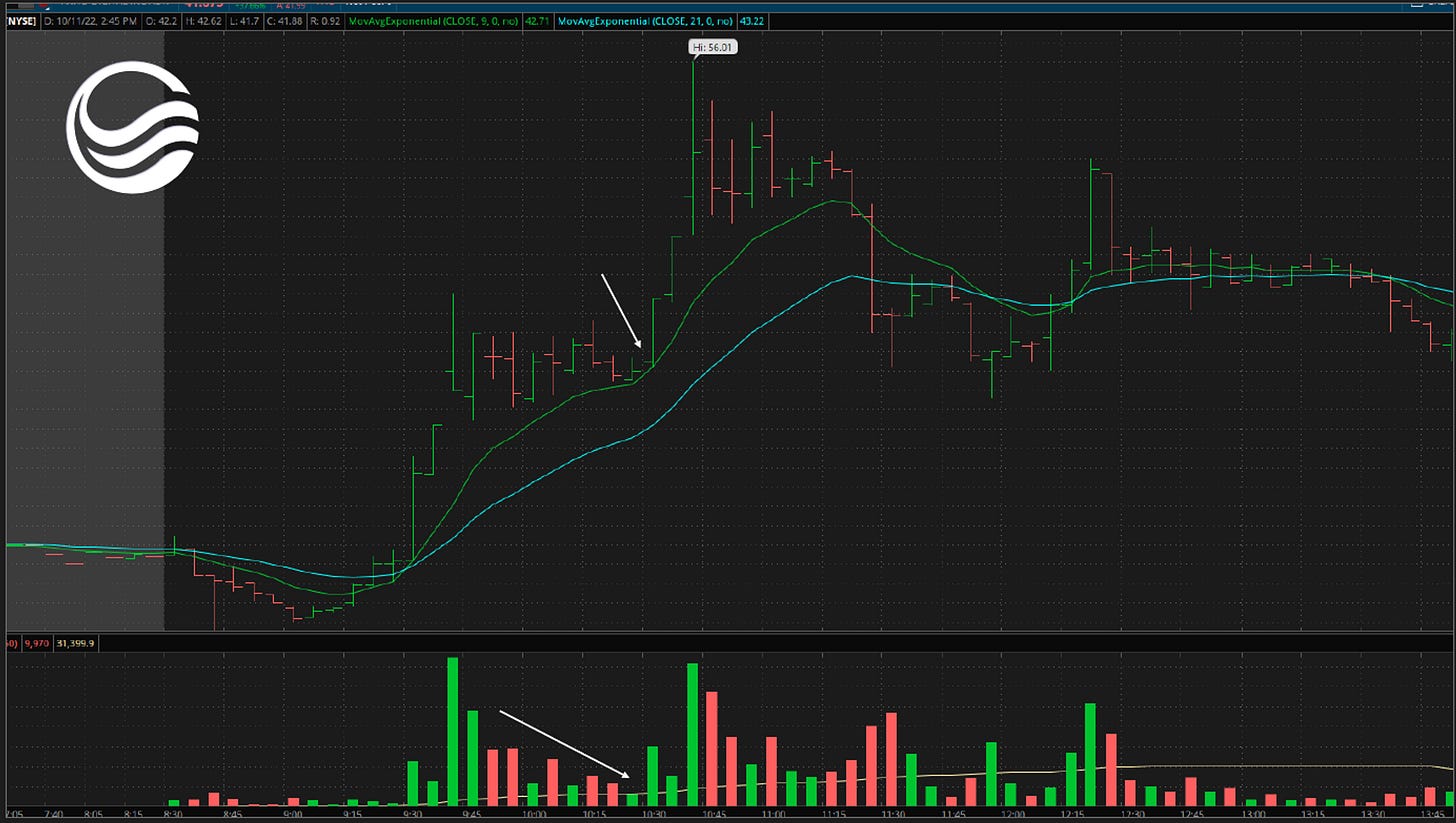
In this example, this could have been perceived as a #1 Bull Flag Breakout setup but remember, on the pullback bars you don't want to see the the chart give back a lot of its price. In this case GG did not take the trade and instead waited to see if an EMA Kiss Fly would emerge … which it did!
He uses the bars high of the highest priced pullback bar in order to be safe and enter with higher confidence that the price will break the range. This decision will depend on risk management progressive exposure and experience.
LIFW 0.00%↑ - 5 Minute Chart
A note I want to bring up. A lot of the time, because most of the stocks that show Setup#1: Bull Flag Breakouts will continue with a Setup#2: EMA Kiss and Fly. And vice versa. This is because most stocks that show this type of action will have strong upward momentum on strong volume and the setups are relatively similar in styles.


